 1
1peptide
spectra
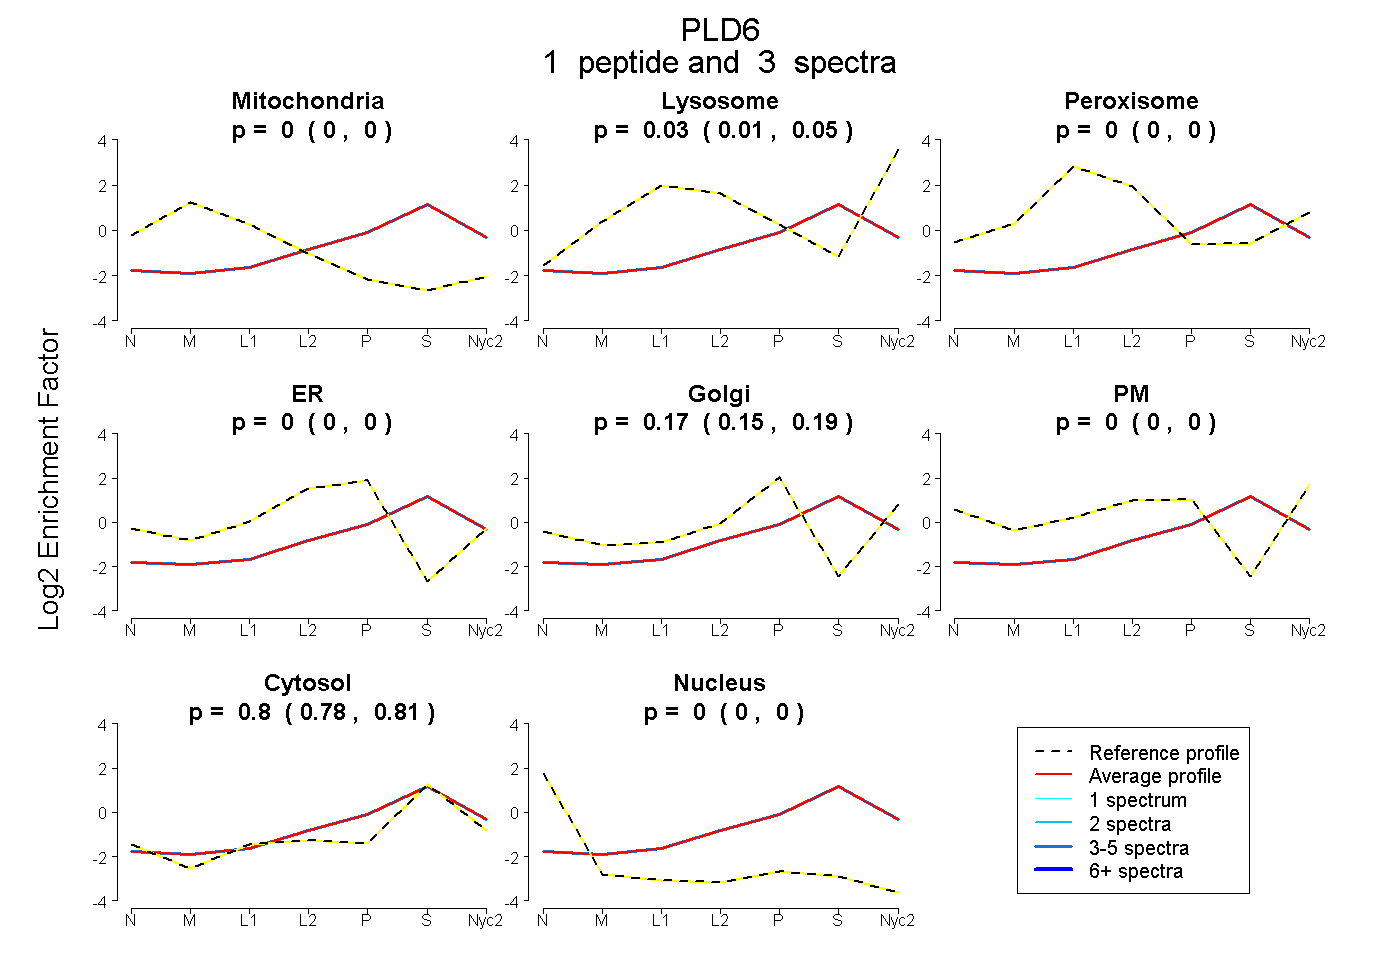
0.000 | 0.000
0.007 | 0.054
0.000 | 0.000
0.000 | 0.000
0.151 | 0.189
0.000 | 0.000
0.780 | 0.810
0.000 | 0.000
2peptides
spectra
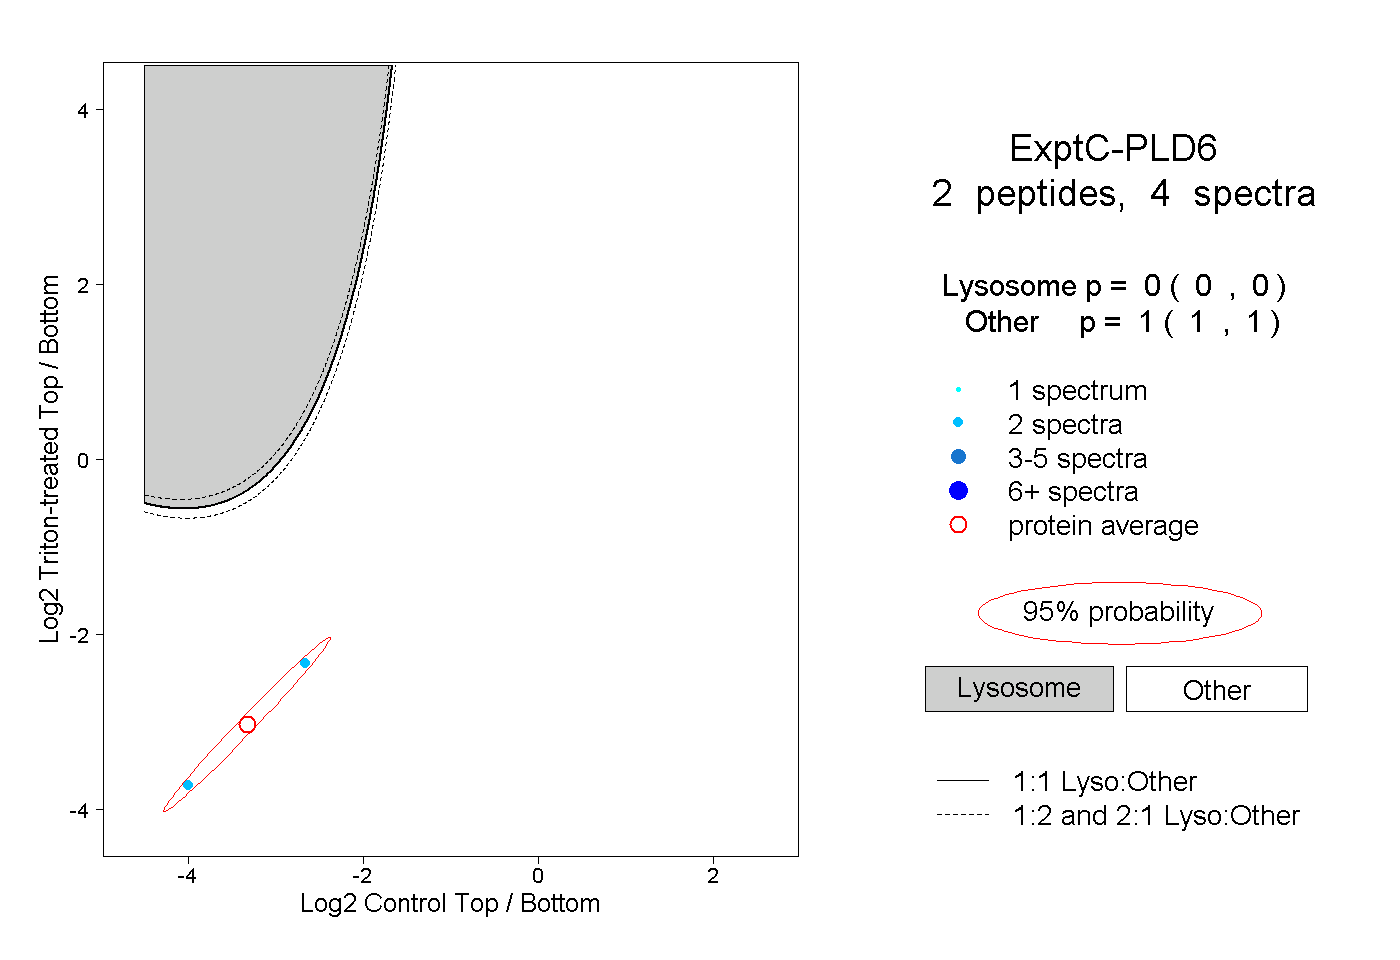
0.000 | 0.000
1.000 | 1.000
| Plot | Mito | Lyso | Perox | ER | Golgi | PM | Cytosol | Nucleus | |||||
| Expt A |
1 peptide |
3 spectra |
|
0.000 0.000 | 0.000 |
0.032 0.007 | 0.054 |
0.000 0.000 | 0.000 |
0.000 0.000 | 0.000 |
0.172 0.151 | 0.189 |
0.000 0.000 | 0.000 |
0.796 0.780 | 0.810 |
0.000 0.000 | 0.000 |
||
| Plot | Lyso | Other | |||||||||||
| Expt C |
2 peptides |
4 spectra |
|
0.000 0.000 | 0.000 |
1.000 1.000 | 1.000 |