29
29peptides
spectra
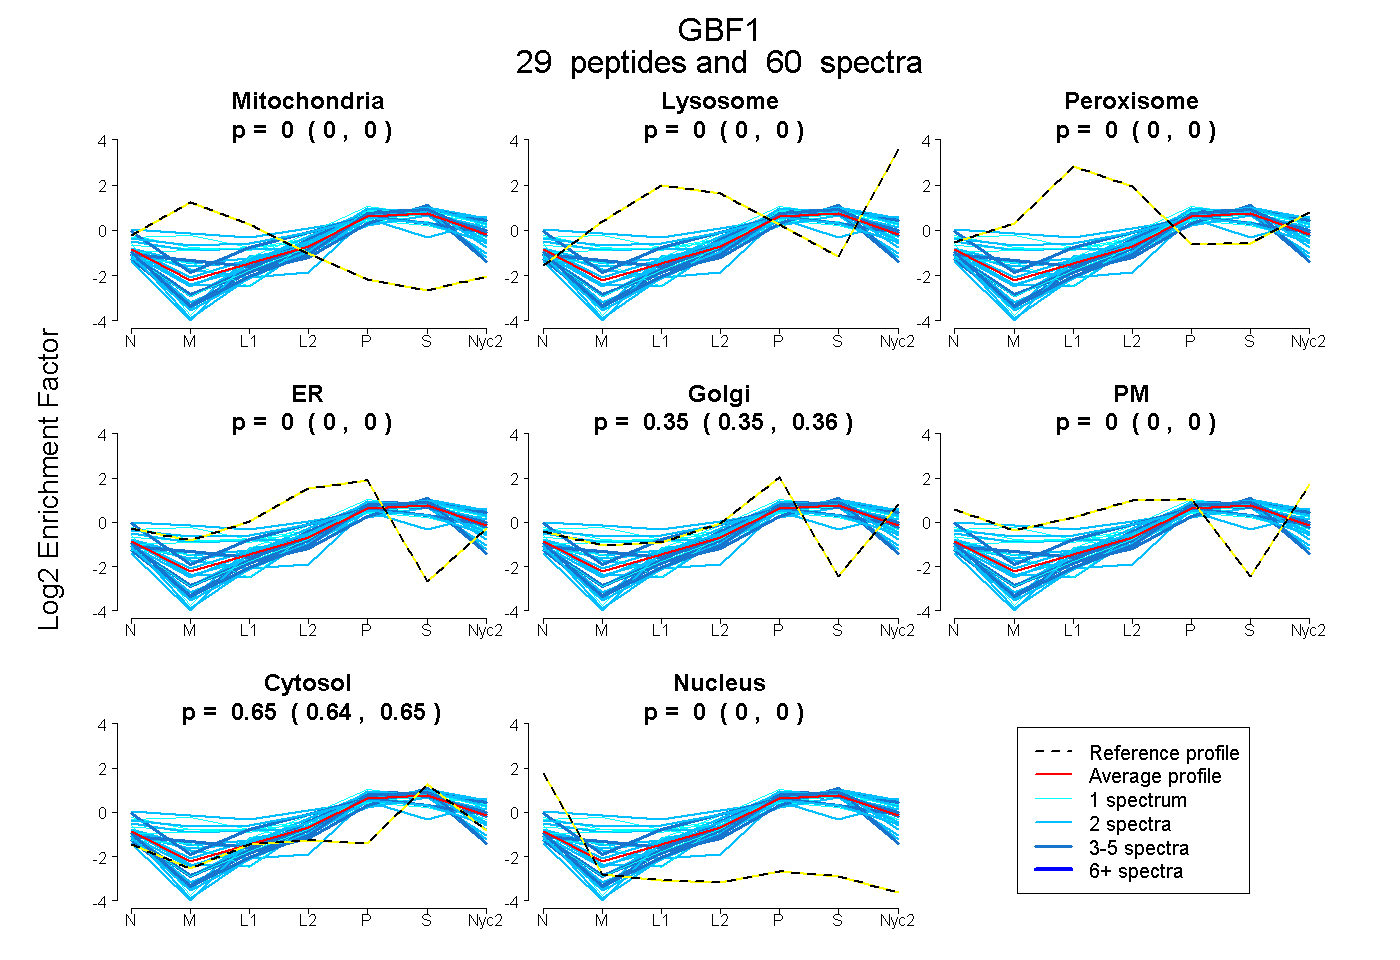
0.000 | 0.000
0.000 | 0.000
0.000 | 0.000
0.000 | 0.000
0.350 | 0.356
0.000 | 0.000
0.643 | 0.650
0.000 | 0.000
7peptides
spectra
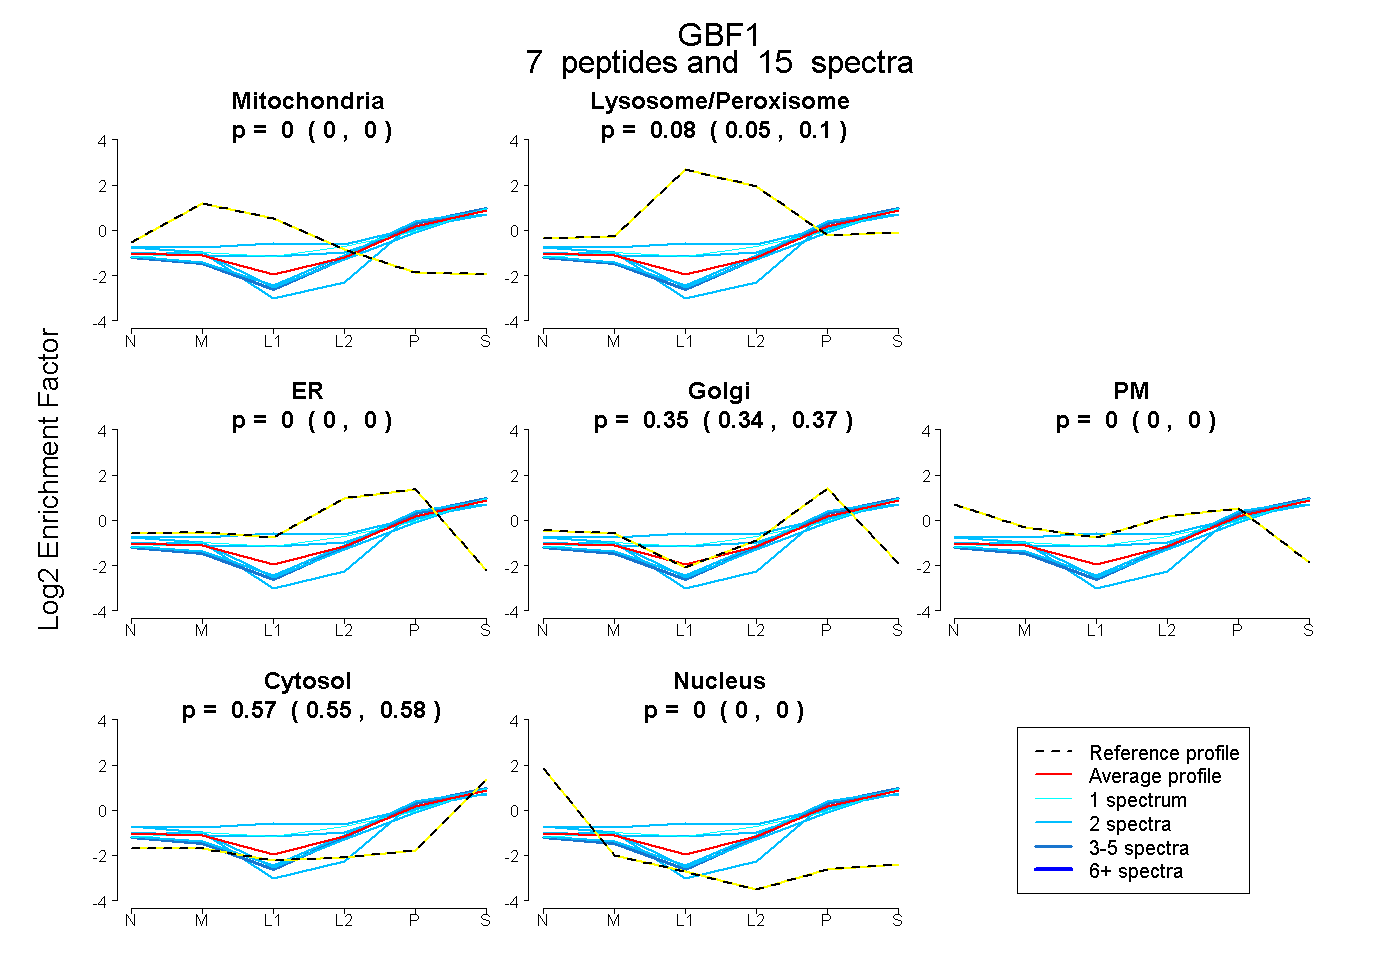
0.000 | 0.000
0.053 | 0.102
0.000 | 0.000
0.336 | 0.369
0.000 | 0.000
0.553 | 0.576
0.000 | 0.000