 29
29peptides
spectra
0.000 | 0.000
0.000 | 0.000
0.000 | 0.000
0.000 | 0.000
0.350 | 0.356
0.000 | 0.000
0.643 | 0.650
0.000 | 0.000
| Plot | Mito | Lyso | Perox | ER | Golgi | PM | Cytosol | Nucleus | |||||
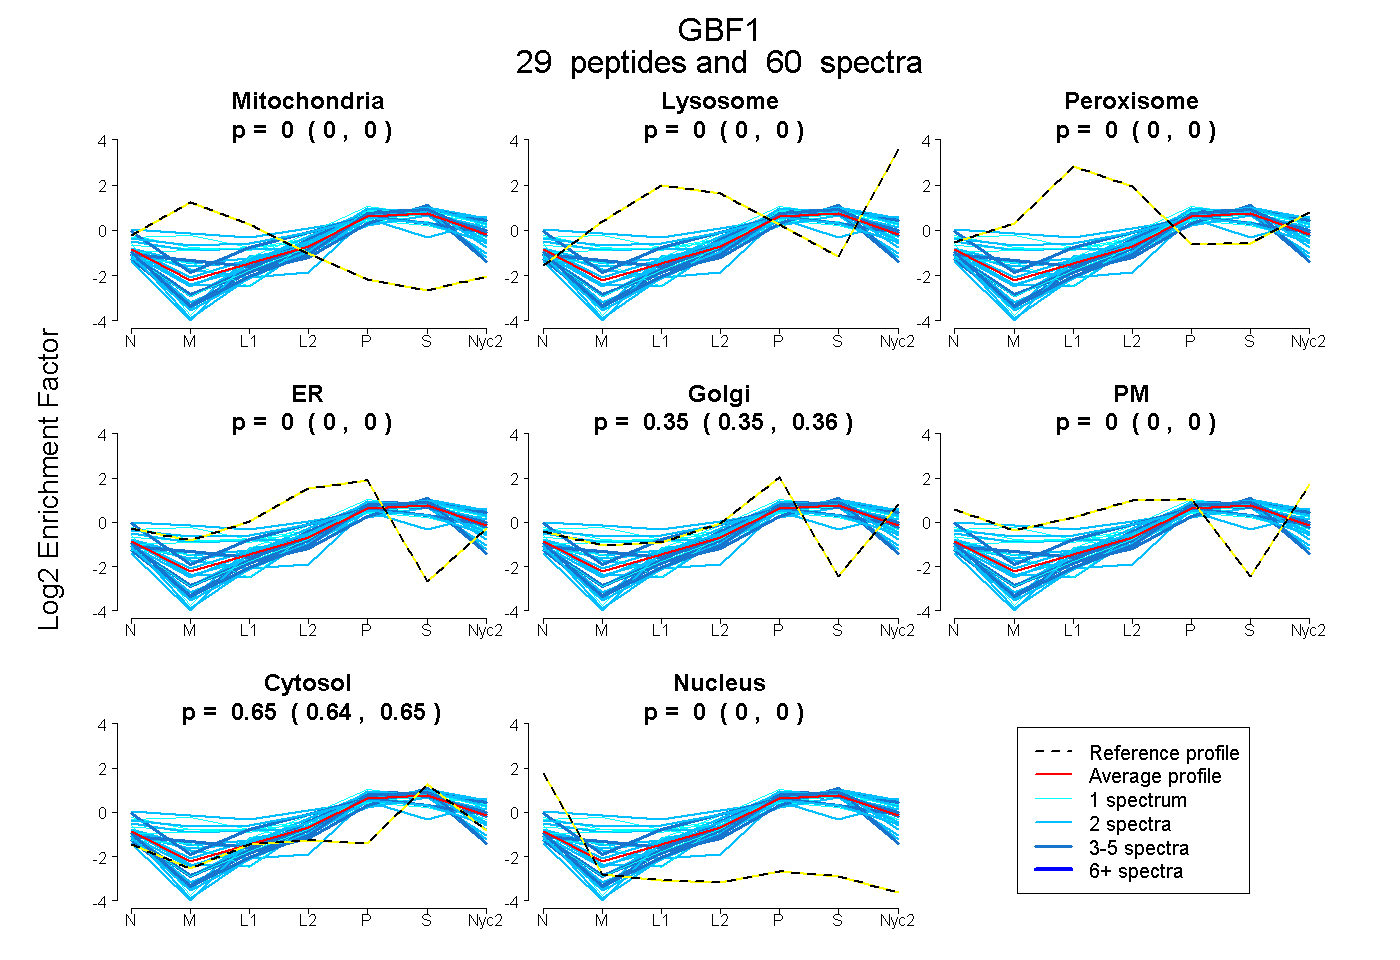
| Expt A |
29 peptides |
60 spectra |
|
0.000 0.000 | 0.000 |
0.000 0.000 | 0.000 |
0.000 0.000 | 0.000 |
0.000 0.000 | 0.000 |
0.353 0.350 | 0.356 |
0.000 0.000 | 0.000 |
0.647 0.643 | 0.650 |
0.000 0.000 | 0.000 |
| 2 spectra, LLENISPADVGGMEETR | 0.000 | 0.000 | 0.000 | 0.000 | 0.337 | 0.000 | 0.663 | 0.000 | ||
| 2 spectra, AASIYSSWAEEQR | 0.000 | 0.017 | 0.000 | 0.000 | 0.355 | 0.000 | 0.628 | 0.000 | ||
| 4 spectra, IDCFLPHLR | 0.000 | 0.000 | 0.000 | 0.069 | 0.192 | 0.000 | 0.739 | 0.000 | ||
| 4 spectra, LLEVFTEHWR | 0.000 | 0.000 | 0.000 | 0.000 | 0.342 | 0.000 | 0.658 | 0.000 | ||
| 1 spectrum, MIGEFVSDR | 0.000 | 0.173 | 0.015 | 0.000 | 0.265 | 0.000 | 0.546 | 0.000 | ||
| 1 spectrum, SLEETIIQK | 0.000 | 0.000 | 0.000 | 0.000 | 0.326 | 0.000 | 0.674 | 0.000 | ||
| 1 spectrum, GPSTENQEAK | 0.000 | 0.000 | 0.000 | 0.121 | 0.230 | 0.000 | 0.650 | 0.000 | ||
| 2 spectra, ICFEMR | 0.091 | 0.000 | 0.048 | 0.140 | 0.122 | 0.000 | 0.599 | 0.000 | ||
| 2 spectra, GATPEGIFLR | 0.000 | 0.000 | 0.000 | 0.000 | 0.276 | 0.000 | 0.724 | 0.000 | ||
| 1 spectrum, FLISLTNPHDR | 0.000 | 0.152 | 0.046 | 0.000 | 0.250 | 0.037 | 0.515 | 0.000 | ||
| 2 spectra, GGSPSALWEITWER | 0.000 | 0.000 | 0.000 | 0.000 | 0.351 | 0.000 | 0.649 | 0.000 | ||
| 2 spectra, HLFQLLSVER | 0.000 | 0.000 | 0.000 | 0.000 | 0.283 | 0.000 | 0.717 | 0.000 | ||
| 1 spectrum, LDEALR | 0.000 | 0.000 | 0.000 | 0.000 | 0.391 | 0.000 | 0.609 | 0.000 | ||
| 2 spectra, ELLEIK | 0.000 | 0.000 | 0.000 | 0.000 | 0.350 | 0.000 | 0.650 | 0.000 | ||
| 2 spectra, FSCLLPDPR | 0.000 | 0.053 | 0.000 | 0.000 | 0.378 | 0.000 | 0.569 | 0.000 | ||
| 2 spectra, VGCVWQTVR | 0.000 | 0.000 | 0.000 | 0.000 | 0.209 | 0.000 | 0.791 | 0.000 | ||
| 3 spectra, VLFPLLTK | 0.000 | 0.000 | 0.000 | 0.000 | 0.266 | 0.000 | 0.734 | 0.000 | ||
| 1 spectrum, AGGMSDSSK | 0.016 | 0.000 | 0.115 | 0.028 | 0.323 | 0.035 | 0.482 | 0.000 | ||
| 2 spectra, EMALEAIVQLWR | 0.045 | 0.000 | 0.156 | 0.000 | 0.164 | 0.332 | 0.303 | 0.000 | ||
| 2 spectra, FVGTDPASDEVVLMK | 0.000 | 0.016 | 0.000 | 0.000 | 0.271 | 0.000 | 0.714 | 0.000 | ||
| 2 spectra, ILGAVLR | 0.000 | 0.000 | 0.000 | 0.000 | 0.246 | 0.000 | 0.688 | 0.066 | ||
| 3 spectra, NEEIVMPEEQTGLVR | 0.000 | 0.000 | 0.000 | 0.180 | 0.059 | 0.214 | 0.546 | 0.000 | ||
| 4 spectra, LPGEAPVIHR | 0.000 | 0.017 | 0.000 | 0.000 | 0.380 | 0.000 | 0.603 | 0.000 | ||
| 2 spectra, TVFHLAHR | 0.018 | 0.000 | 0.147 | 0.217 | 0.158 | 0.000 | 0.460 | 0.000 | ||
| 3 spectra, LDALEWESCFNK | 0.000 | 0.000 | 0.000 | 0.000 | 0.129 | 0.000 | 0.859 | 0.012 | ||
| 2 spectra, MQALTYLQR | 0.000 | 0.025 | 0.000 | 0.000 | 0.380 | 0.000 | 0.595 | 0.000 | ||
| 1 spectrum, GIQFLQEK | 0.160 | 0.000 | 0.056 | 0.000 | 0.354 | 0.000 | 0.430 | 0.000 | ||
| 2 spectra, NMLLVMDTAEIFHSADAR | 0.000 | 0.000 | 0.000 | 0.000 | 0.262 | 0.000 | 0.738 | 0.000 | ||
| 2 spectra, AVVGLLR | 0.000 | 0.000 | 0.000 | 0.000 | 0.193 | 0.000 | 0.807 | 0.000 |
| Plot | Mito | Lyso or Perox | ER | Golgi | PM | Cytosol | Nucleus | ||||||
| Expt B |
7 peptides |
15 spectra |
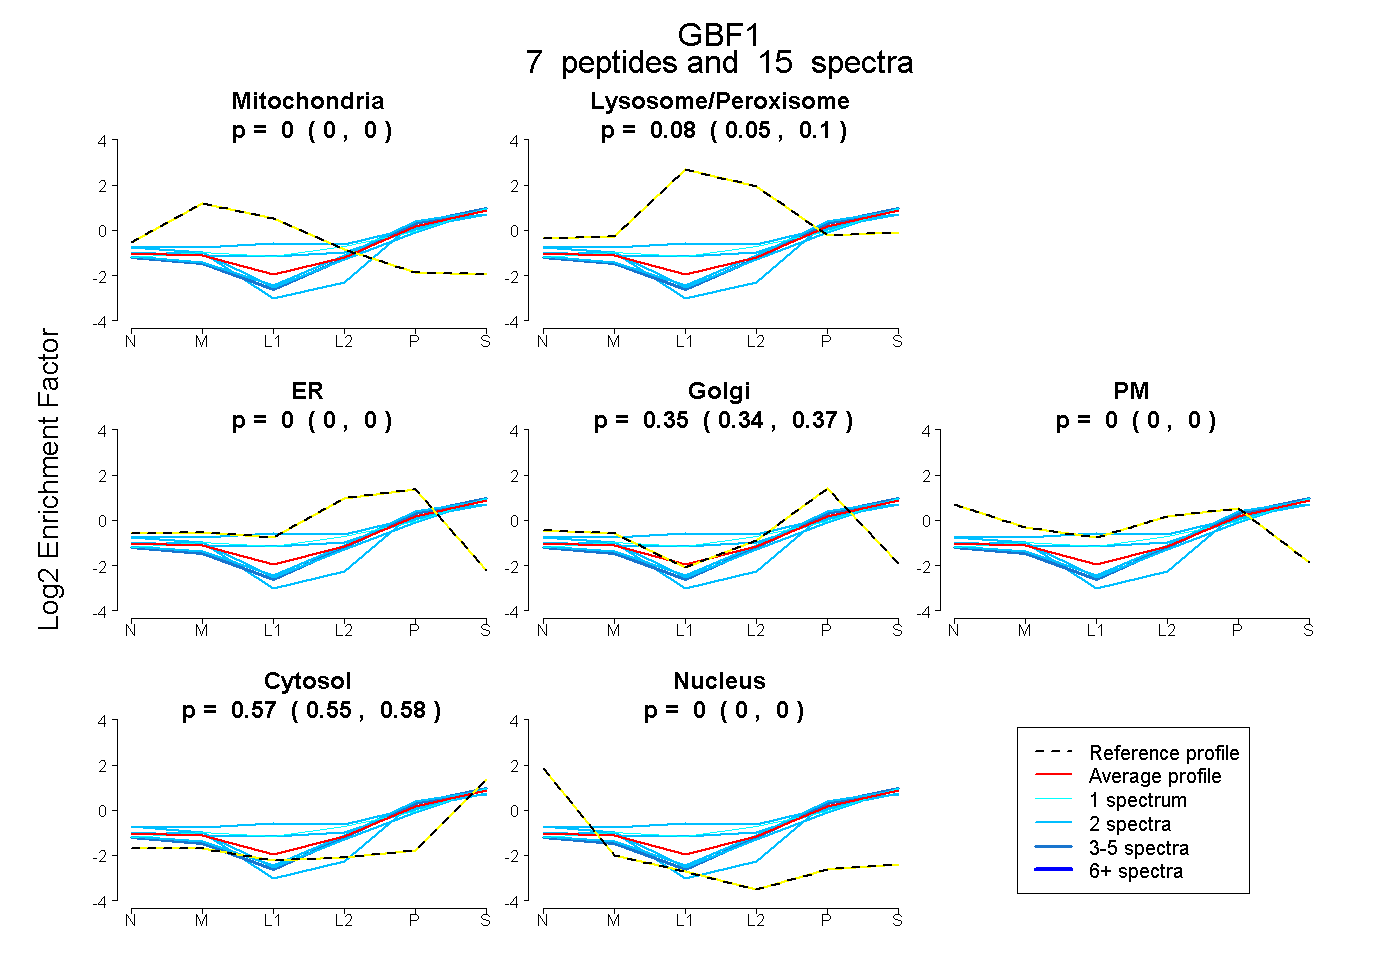 |
0.000 0.000 | 0.000 |
0.081 0.053 | 0.102 |
0.000 0.000 | 0.000 |
0.354 0.336 | 0.369 |
0.000 0.000 | 0.000 |
0.565 0.553 | 0.576 |
0.000 0.000 | 0.000 |
|||
| Plot | Lyso | Other | |||||||||||
| Expt C |
34 peptides |
88 spectra |
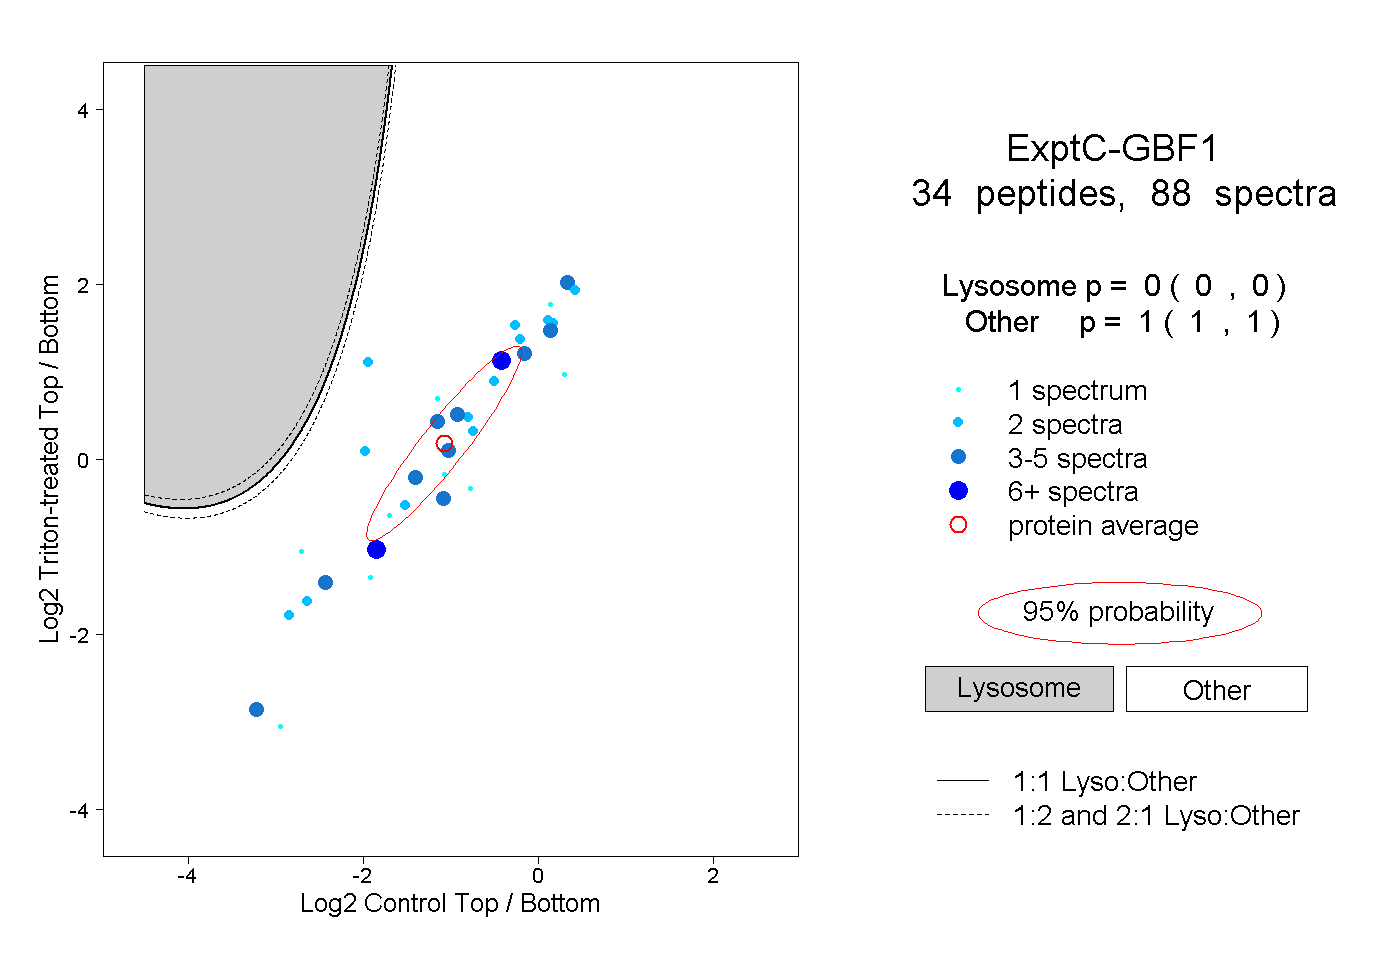 |
0.000 0.000 | 0.000 |
1.000 1.000 | 1.000 |
||||||||
| Plot | Lyso | Other | |||||||||||
| Expt D |
2 peptides |
2 spectra |
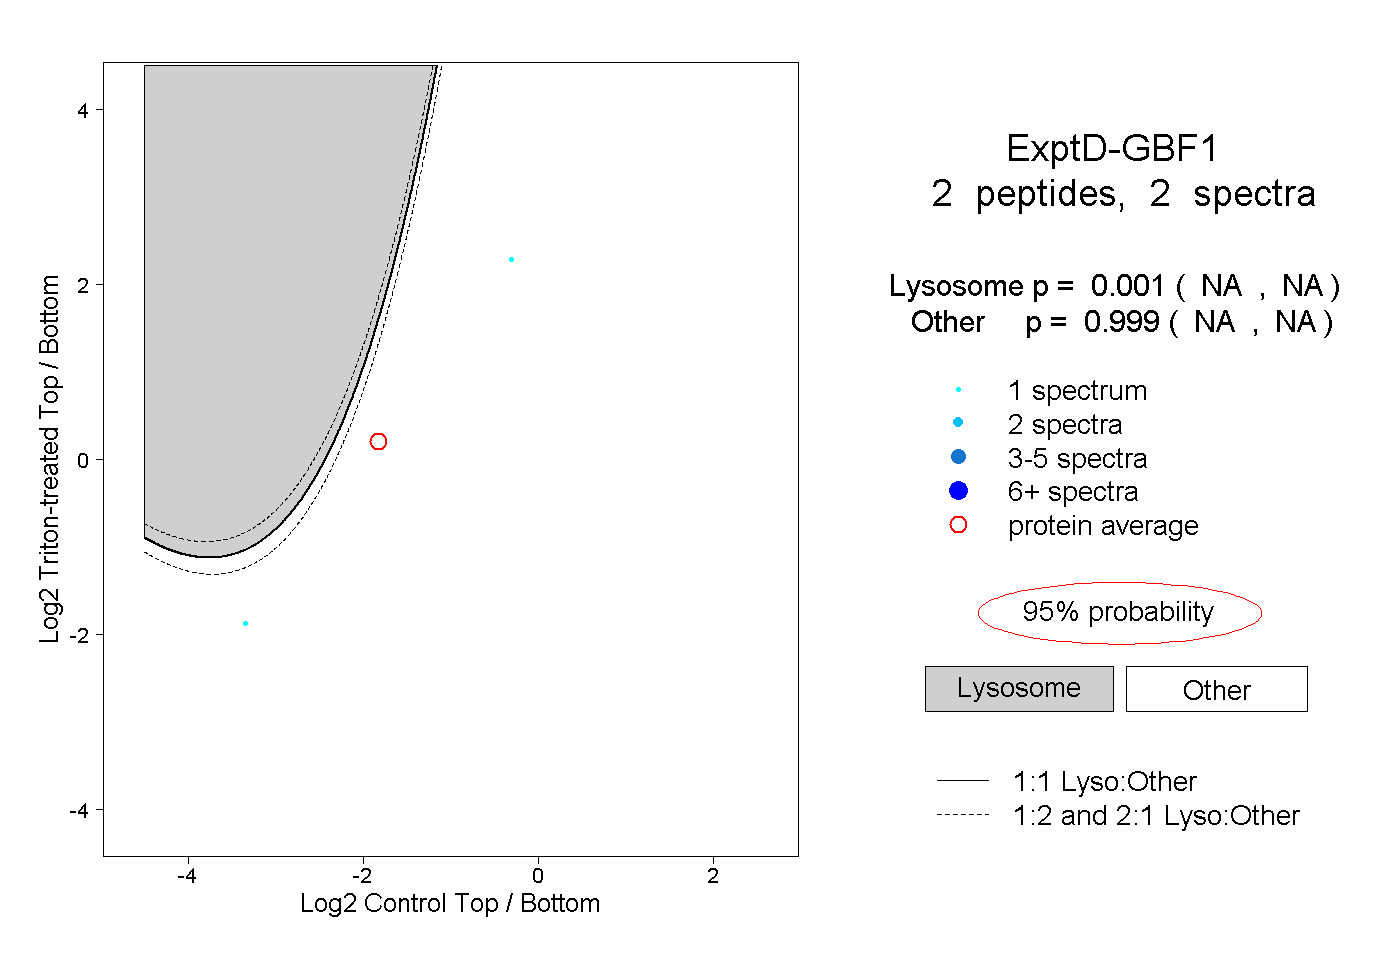 |
0.001 NA | NA |
0.999 NA | NA |