 7
7peptides
spectra
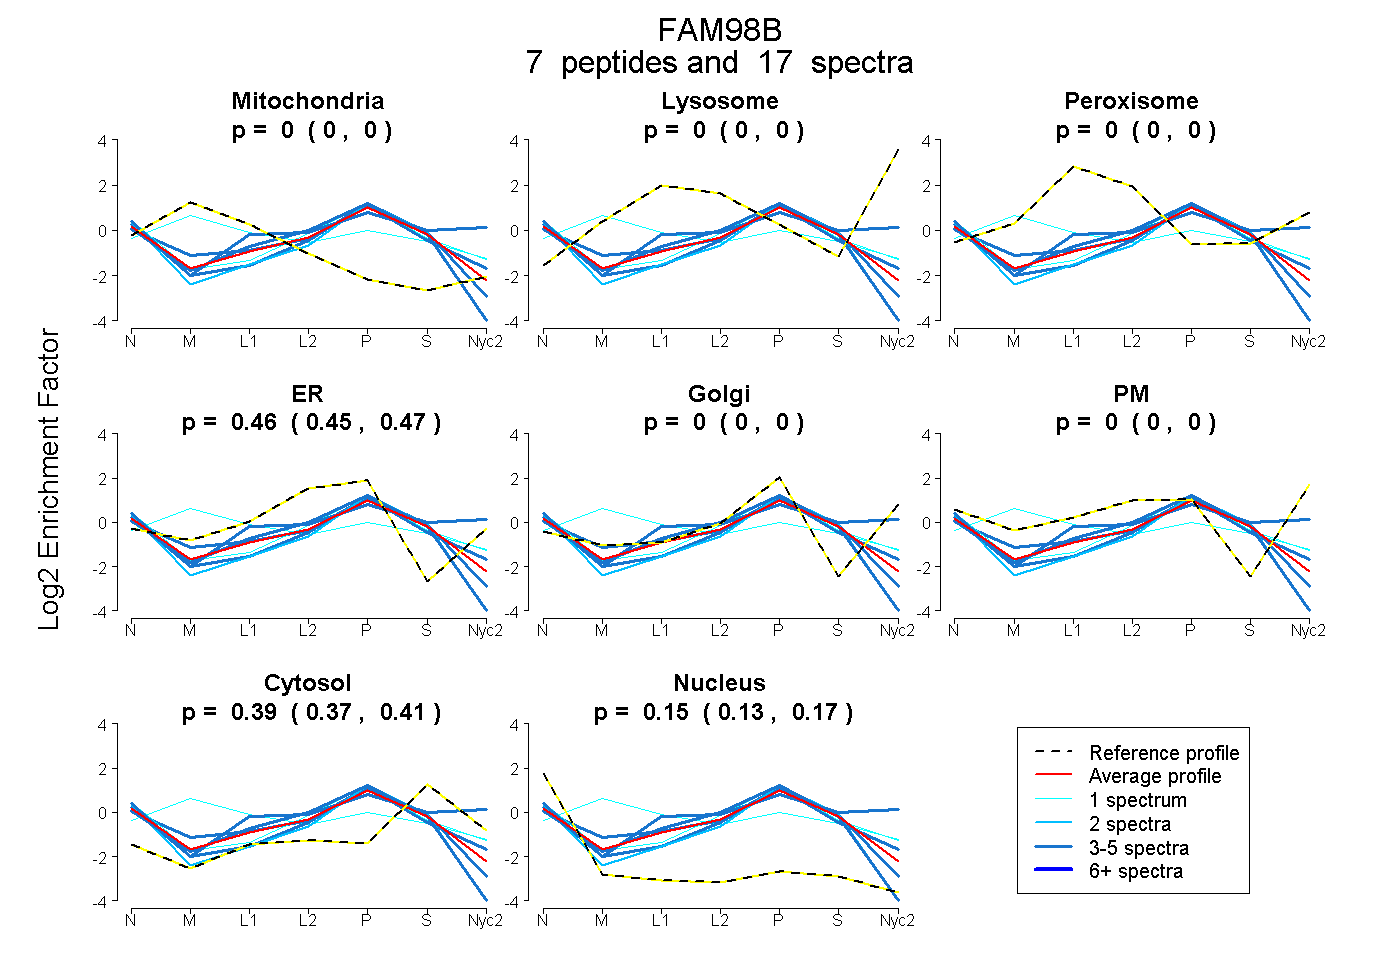
0.000 | 0.000
0.000 | 0.000
0.000 | 0.000
0.446 | 0.469
0.000 | 0.000
0.000 | 0.000
0.374 | 0.405
0.130 | 0.169
| Plot | Mito | Lyso | Perox | ER | Golgi | PM | Cytosol | Nucleus | |||||
| Expt A |
7 peptides |
17 spectra |
|
0.000 0.000 | 0.000 |
0.000 0.000 | 0.000 |
0.000 0.000 | 0.000 |
0.458 0.446 | 0.469 |
0.000 0.000 | 0.000 |
0.000 0.000 | 0.000 |
0.391 0.374 | 0.405 |
0.151 0.130 | 0.169 |
| 3 spectra, VDLTSEQAEK | 0.000 | 0.000 | 0.000 | 0.153 | 0.000 | 0.378 | 0.469 | 0.000 | ||
| 3 spectra, TTVTLAHLLAAR | 0.000 | 0.000 | 0.000 | 0.457 | 0.000 | 0.000 | 0.310 | 0.232 | ||
| 1 spectrum, NSQLDK | 0.000 | 0.000 | 0.000 | 0.420 | 0.102 | 0.000 | 0.360 | 0.118 | ||
| 4 spectra, INDALSCEYECR | 0.000 | 0.000 | 0.000 | 0.401 | 0.000 | 0.000 | 0.375 | 0.223 | ||
| 1 spectrum, DDLEGFQLEISGFLK | 0.394 | 0.000 | 0.134 | 0.078 | 0.157 | 0.000 | 0.237 | 0.000 | ||
| 3 spectra, EMACPYSVLVSGDIK | 0.000 | 0.000 | 0.000 | 0.521 | 0.000 | 0.000 | 0.366 | 0.113 | ||
| 2 spectra, SLCNLEESITSAGR | 0.000 | 0.000 | 0.000 | 0.343 | 0.000 | 0.000 | 0.335 | 0.322 |
| Plot | Mito | Lyso or Perox | ER | Golgi | PM | Cytosol | Nucleus | ||||||
| Expt B |
1 peptide |
4 spectra |
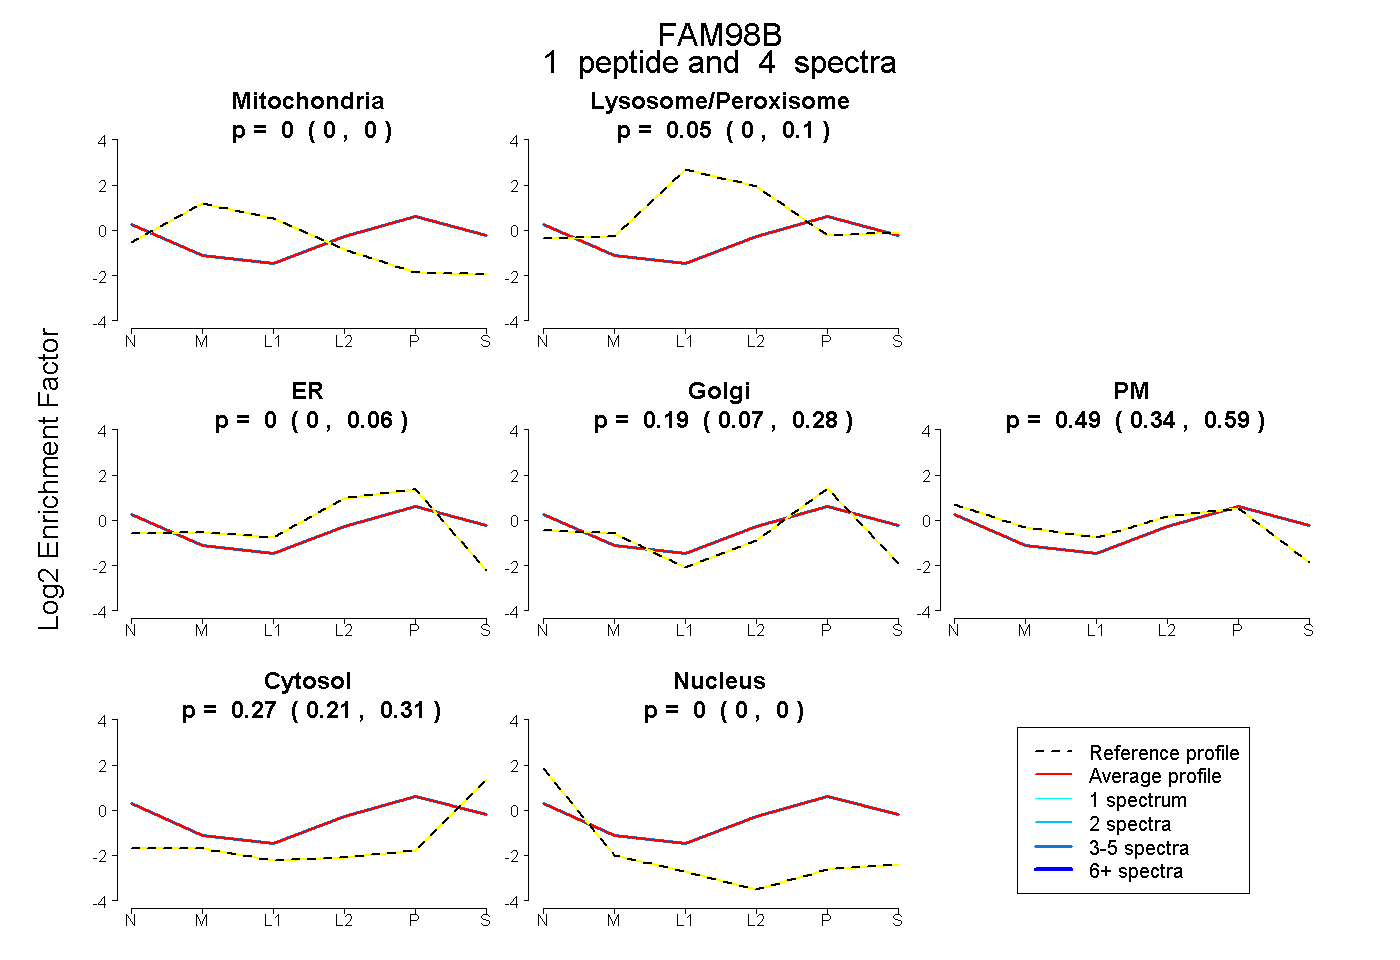 |
0.000 0.000 | 0.000 |
0.054 0.000 | 0.097 |
0.000 0.000 | 0.055 |
0.190 0.071 | 0.285 |
0.486 0.343 | 0.590 |
0.270 0.215 | 0.312 |
0.000 0.000 | 0.000 |
|||
| Plot | Lyso | Other | |||||||||||
| Expt C |
3 peptides |
9 spectra |
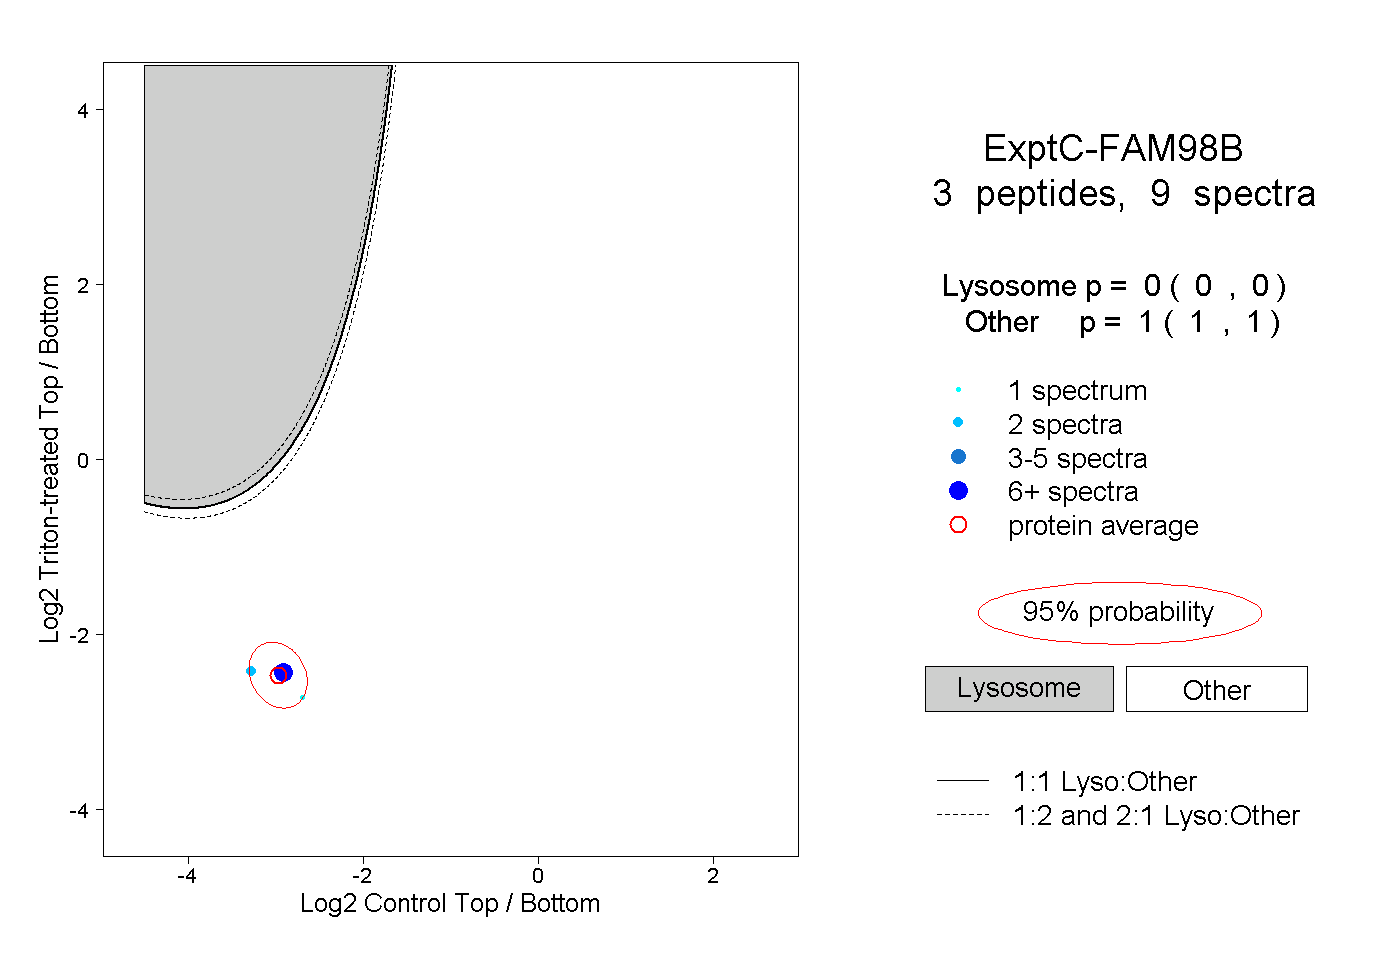 |
0.000 0.000 | 0.000 |
1.000 1.000 | 1.000 |