 9
9peptides
spectra
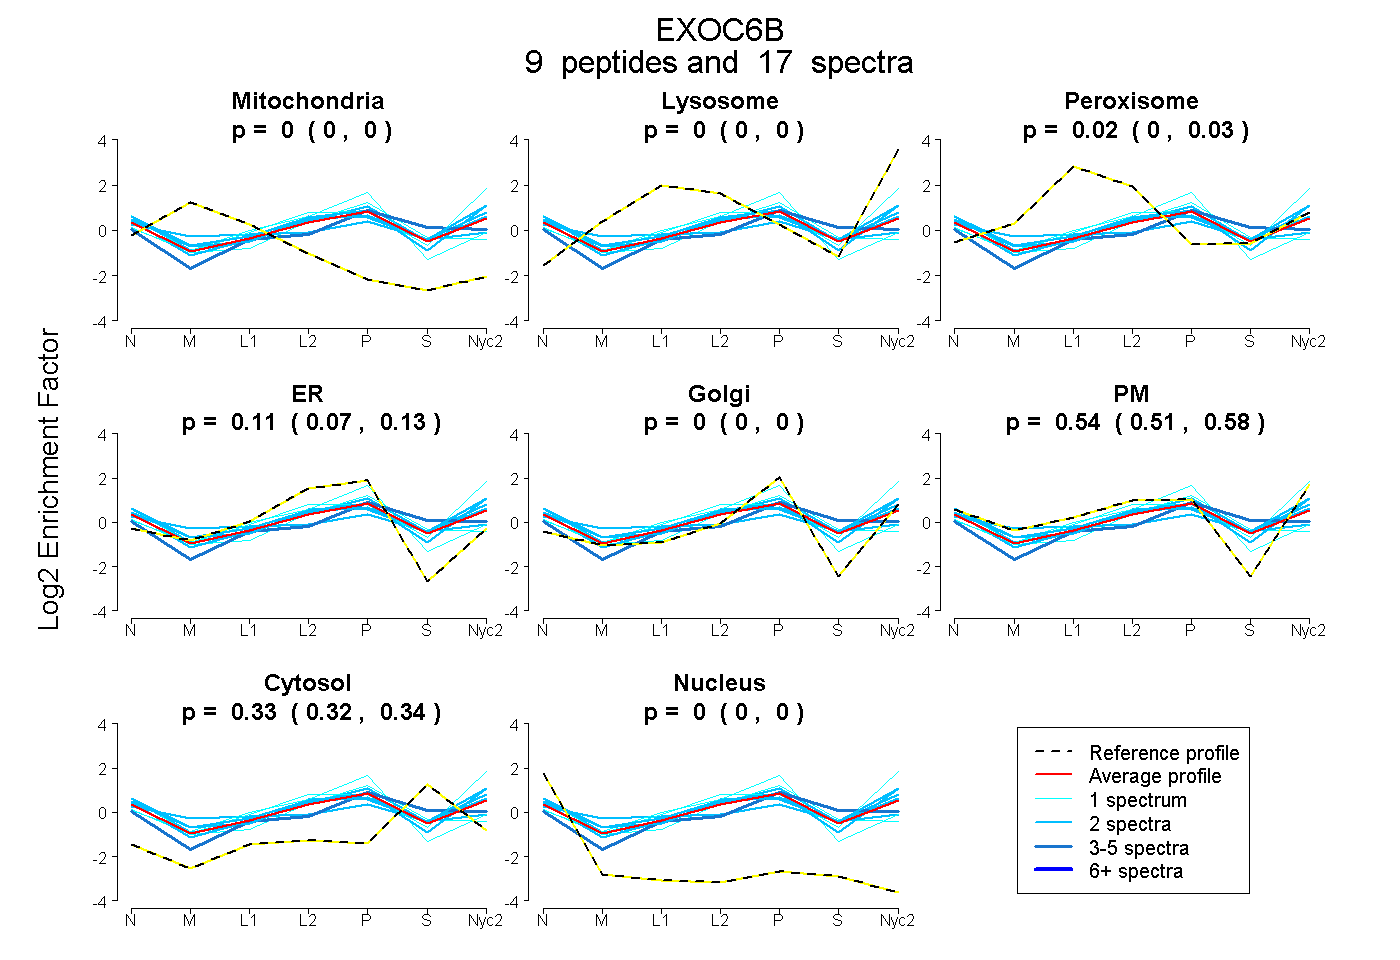
0.000 | 0.000
0.000 | 0.000
0.004 | 0.025
0.070 | 0.134
0.000 | 0.000
0.506 | 0.577
0.325 | 0.342
0.000 | 0.000
1peptide
spectrum
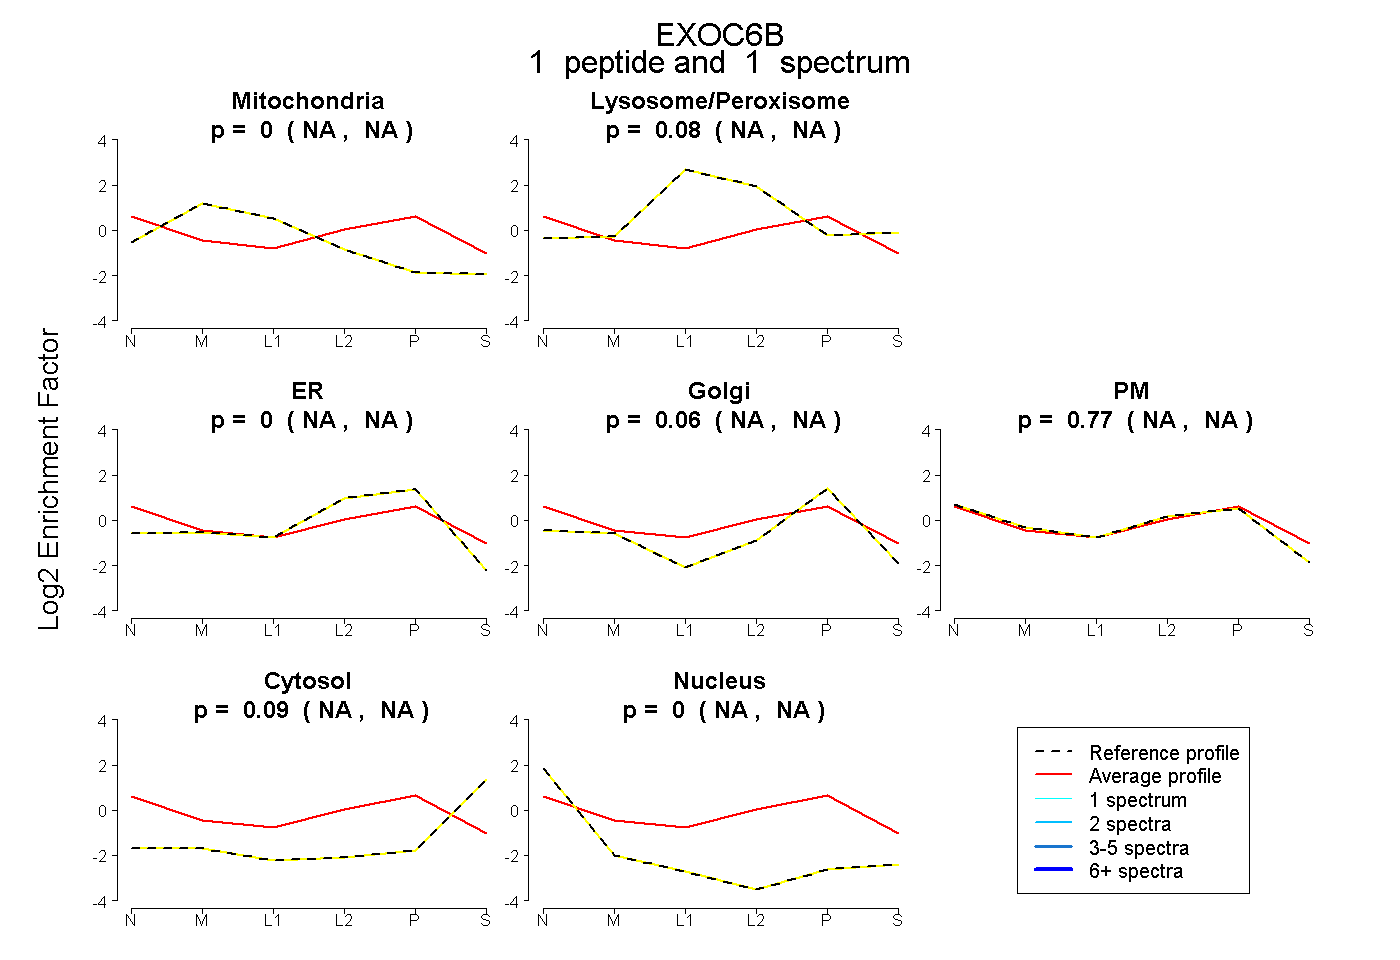
NA | NA
NA | NA
NA | NA
NA | NA
NA | NA
NA | NA
NA | NA
4peptides
spectra

0.000 | 0.000
1.000 | 1.000