 1
1peptide
spectrum
NA | NA
NA | NA
NA | NA
NA | NA
NA | NA
NA | NA
NA | NA
NA | NA
3peptides
spectra
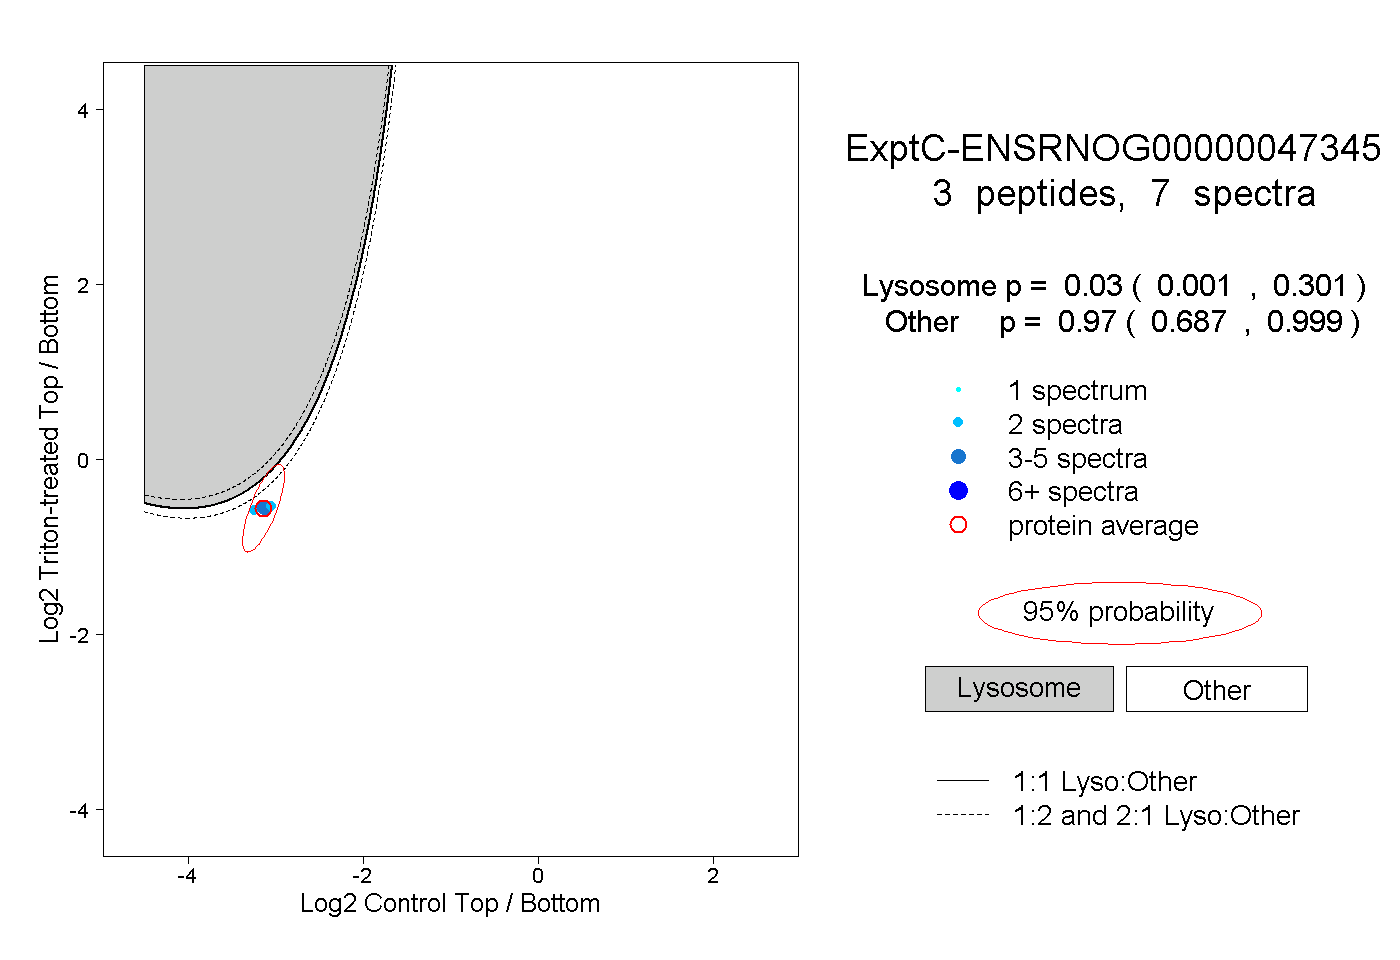
0.001 | 0.301
0.687 | 0.999
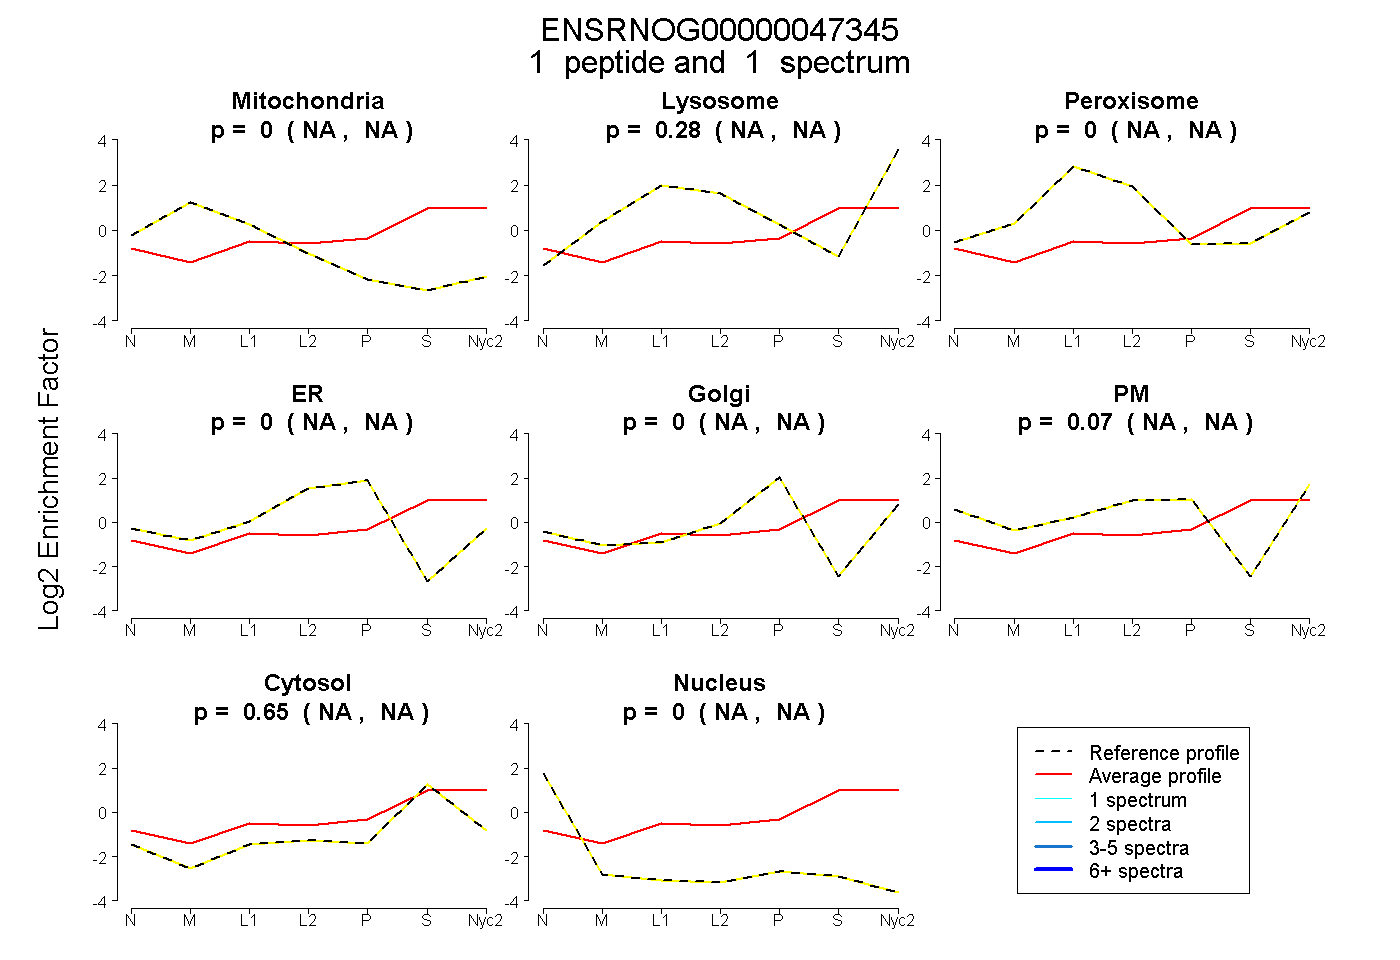
| Plot | Mito | Lyso | Perox | ER | Golgi | PM | Cytosol | Nucleus | |||||
| Expt A |
1 peptide |
1 spectrum |
|
0.000 NA | NA |
0.280 NA | NA |
0.000 NA | NA |
0.000 NA | NA |
0.000 NA | NA |
0.074 NA | NA |
0.646 NA | NA |
0.000 NA | NA |
||
| Plot | Lyso | Other | |||||||||||
| Expt C |
3 peptides |
7 spectra |
|
0.030 0.001 | 0.301 |
0.970 0.687 | 0.999 |