 2
2peptides
spectra
0.000 | 0.000
0.000 | 0.026
0.000 | 0.036
0.000 | 0.123
0.412 | 0.711
0.000 | 0.230
0.239 | 0.338
0.000 | 0.026
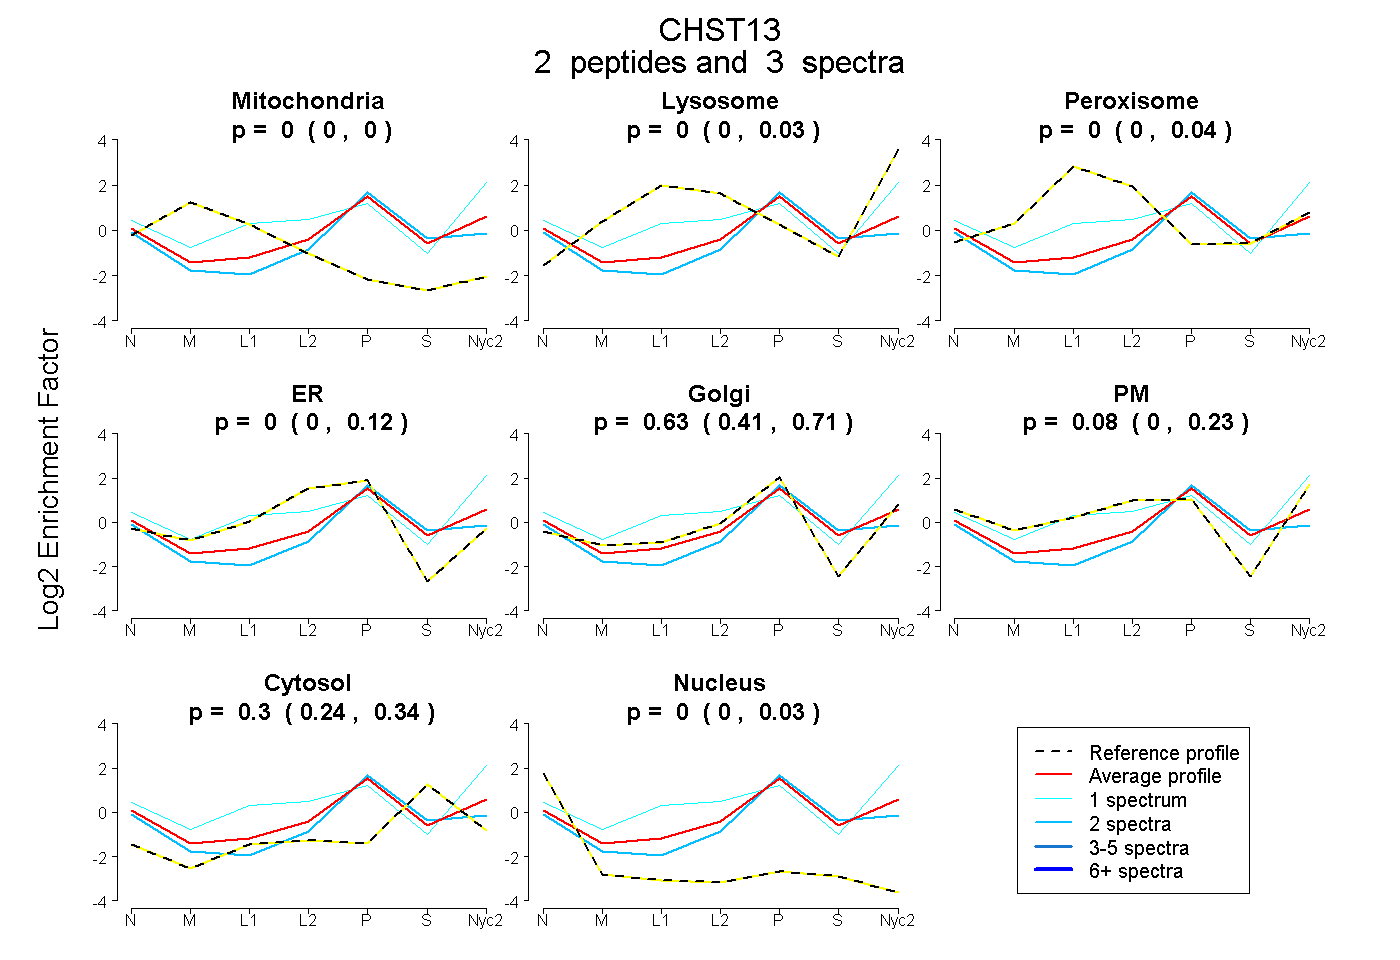
| Plot | Mito | Lyso | Perox | ER | Golgi | PM | Cytosol | Nucleus | |||||
| Expt A |
2 peptides |
3 spectra |
|
0.000 0.000 | 0.000 |
0.000 0.000 | 0.026 |
0.000 0.000 | 0.036 |
0.000 0.000 | 0.123 |
0.626 0.412 | 0.711 |
0.078 0.000 | 0.230 |
0.295 0.239 | 0.338 |
0.000 0.000 | 0.026 |
| 2 spectra, VLLALR | 0.000 | 0.000 | 0.000 | 0.000 | 0.608 | 0.000 | 0.361 | 0.031 | ||
| 1 spectrum, LLQPEDLR | 0.000 | 0.169 | 0.000 | 0.000 | 0.032 | 0.668 | 0.132 | 0.000 |