 1
1peptide
spectra
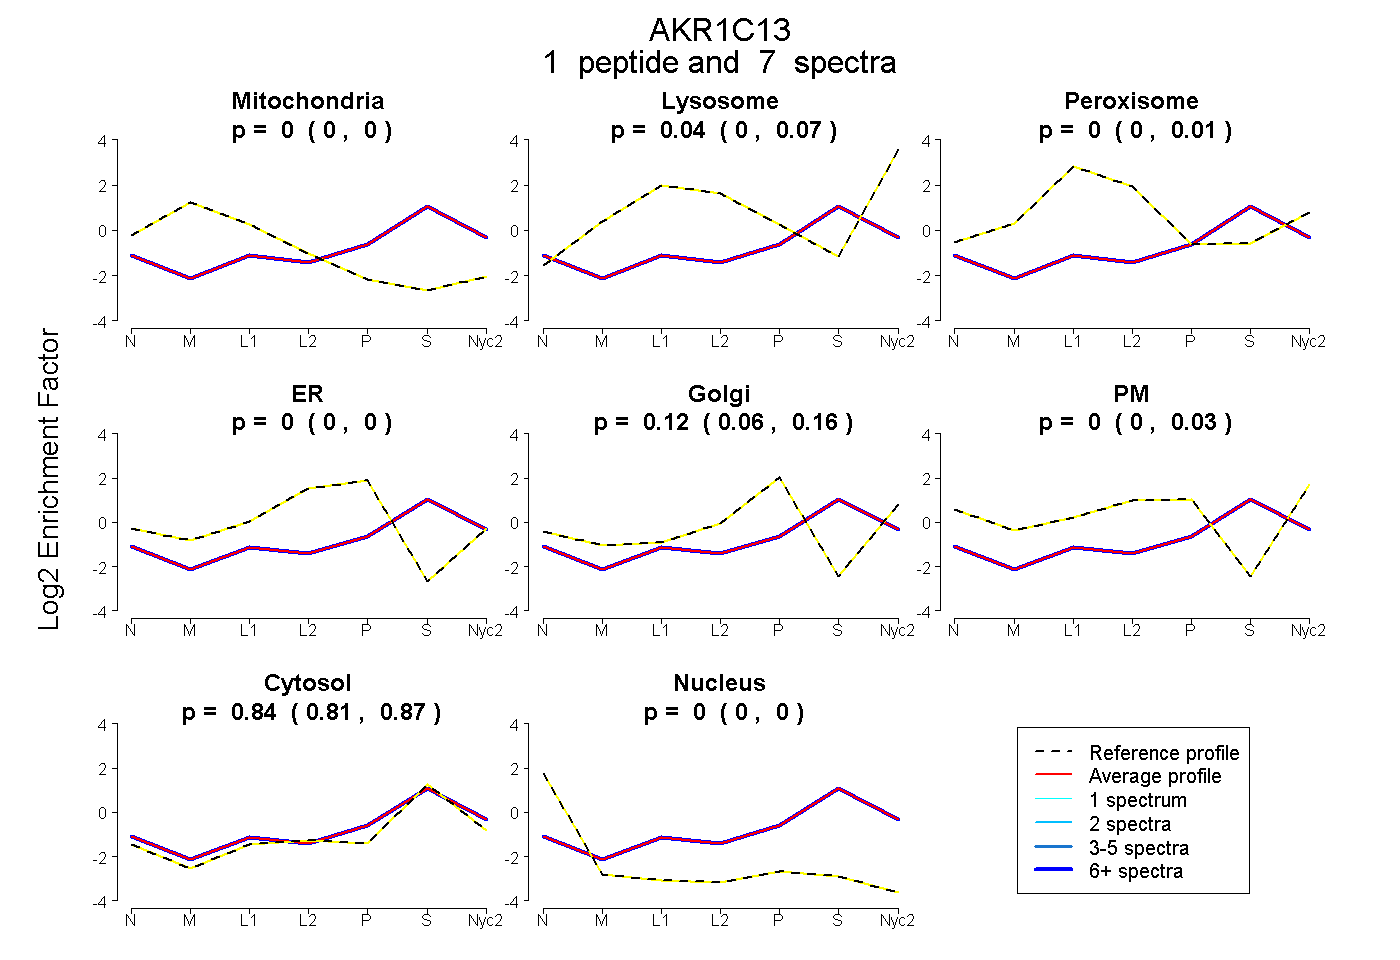
0.000 | 0.002
0.000 | 0.067
0.000 | 0.011
0.000 | 0.000
0.056 | 0.159
0.000 | 0.032
0.807 | 0.869
0.000 | 0.000
1peptide
spectra
0.000 | 0.000
1.000 | 1.000
| Plot | Mito | Lyso | Perox | ER | Golgi | PM | Cytosol | Nucleus | |||||
| Expt A |
1 peptide |
7 spectra |
|
0.000 0.000 | 0.002 |
0.037 0.000 | 0.067 |
0.000 0.000 | 0.011 |
0.000 0.000 | 0.000 |
0.122 0.056 | 0.159 |
0.000 0.000 | 0.032 |
0.840 0.807 | 0.869 |
0.000 0.000 | 0.000 |
||
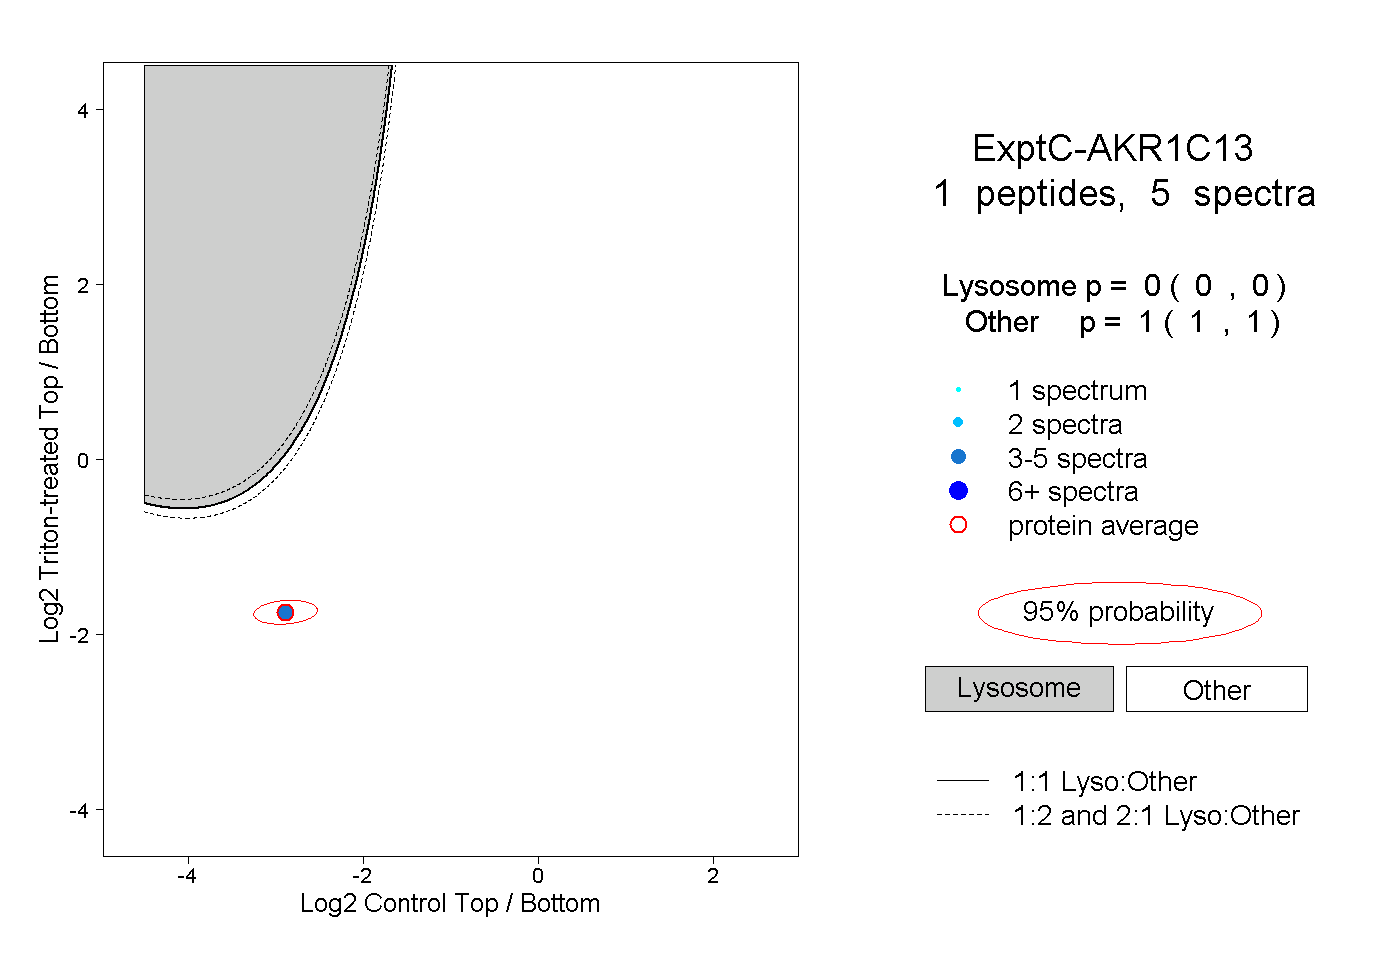
| Plot | Lyso | Other | |||||||||||
| Expt C |
1 peptide |
5 spectra |
|
0.000 0.000 | 0.000 |
1.000 1.000 | 1.000 |