 9
9peptides
spectra
0.240 | 0.274
0.000 | 0.000
0.344 | 0.396
0.351 | 0.383
0.000 | 0.000
0.000 | 0.000
0.000 | 0.000
0.000 | 0.000
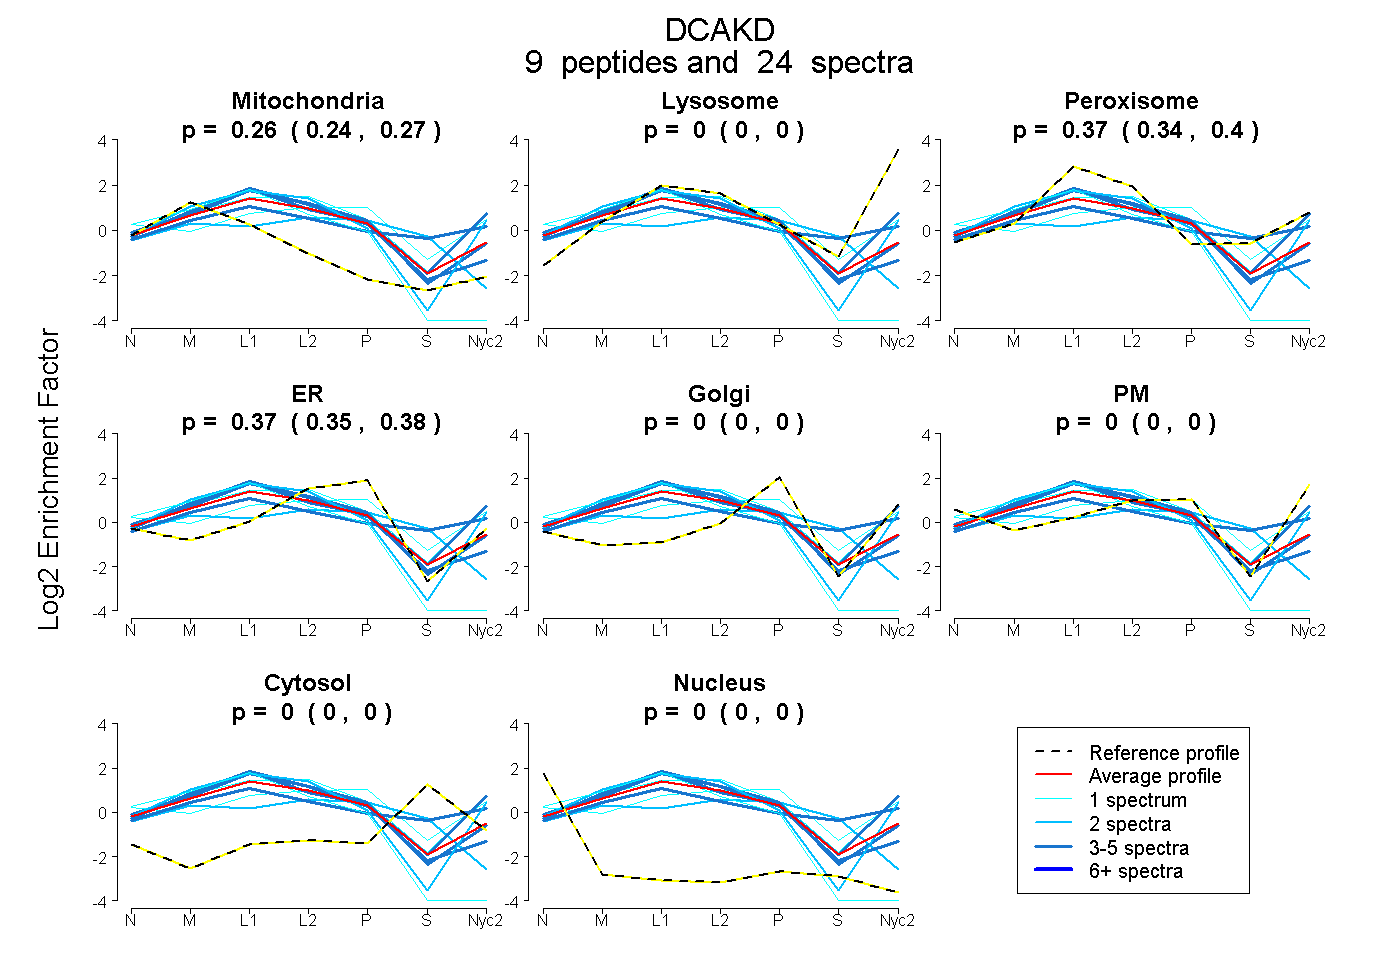
| Plot | Mito | Lyso | Perox | ER | Golgi | PM | Cytosol | Nucleus | |||||
| Expt A |
9 peptides |
24 spectra |
|
0.258 0.240 | 0.274 |
0.000 0.000 | 0.000 |
0.372 0.344 | 0.396 |
0.370 0.351 | 0.383 |
0.000 0.000 | 0.000 |
0.000 0.000 | 0.000 |
0.000 0.000 | 0.000 |
0.000 0.000 | 0.000 |
| 2 spectra, VLGDLIFNQPDR | 0.270 | 0.190 | 0.151 | 0.241 | 0.000 | 0.149 | 0.000 | 0.000 | ||
| 3 spectra, QLLNSITHPEIR | 0.319 | 0.000 | 0.354 | 0.327 | 0.000 | 0.000 | 0.000 | 0.000 | ||
| 5 spectra, MFLVGLTGGIASGK | 0.232 | 0.000 | 0.374 | 0.395 | 0.000 | 0.000 | 0.000 | 0.000 | ||
| 1 spectrum, YVILDIPLLFETK | 0.670 | 0.000 | 0.000 | 0.330 | 0.000 | 0.000 | 0.000 | 0.000 | ||
| 1 spectrum, HIVQPGCPAHR | 0.020 | 0.000 | 0.327 | 0.197 | 0.168 | 0.248 | 0.039 | 0.000 | ||
| 2 spectra, HTVVVYCDR | 0.313 | 0.000 | 0.098 | 0.349 | 0.000 | 0.000 | 0.240 | 0.000 | ||
| 1 spectrum, INSQLPLK | 0.116 | 0.168 | 0.336 | 0.242 | 0.000 | 0.138 | 0.000 | 0.000 | ||
| 5 spectra, MANHVLDNSGEWSLTR | 0.128 | 0.000 | 0.545 | 0.000 | 0.186 | 0.000 | 0.141 | 0.000 | ||
| 4 spectra, SMEYLPLR | 0.158 | 0.086 | 0.389 | 0.071 | 0.000 | 0.297 | 0.000 | 0.000 |
| Plot | Mito | Lyso or Perox | ER | Golgi | PM | Cytosol | Nucleus | ||||||
| Expt B |
1 peptide |
1 spectrum |
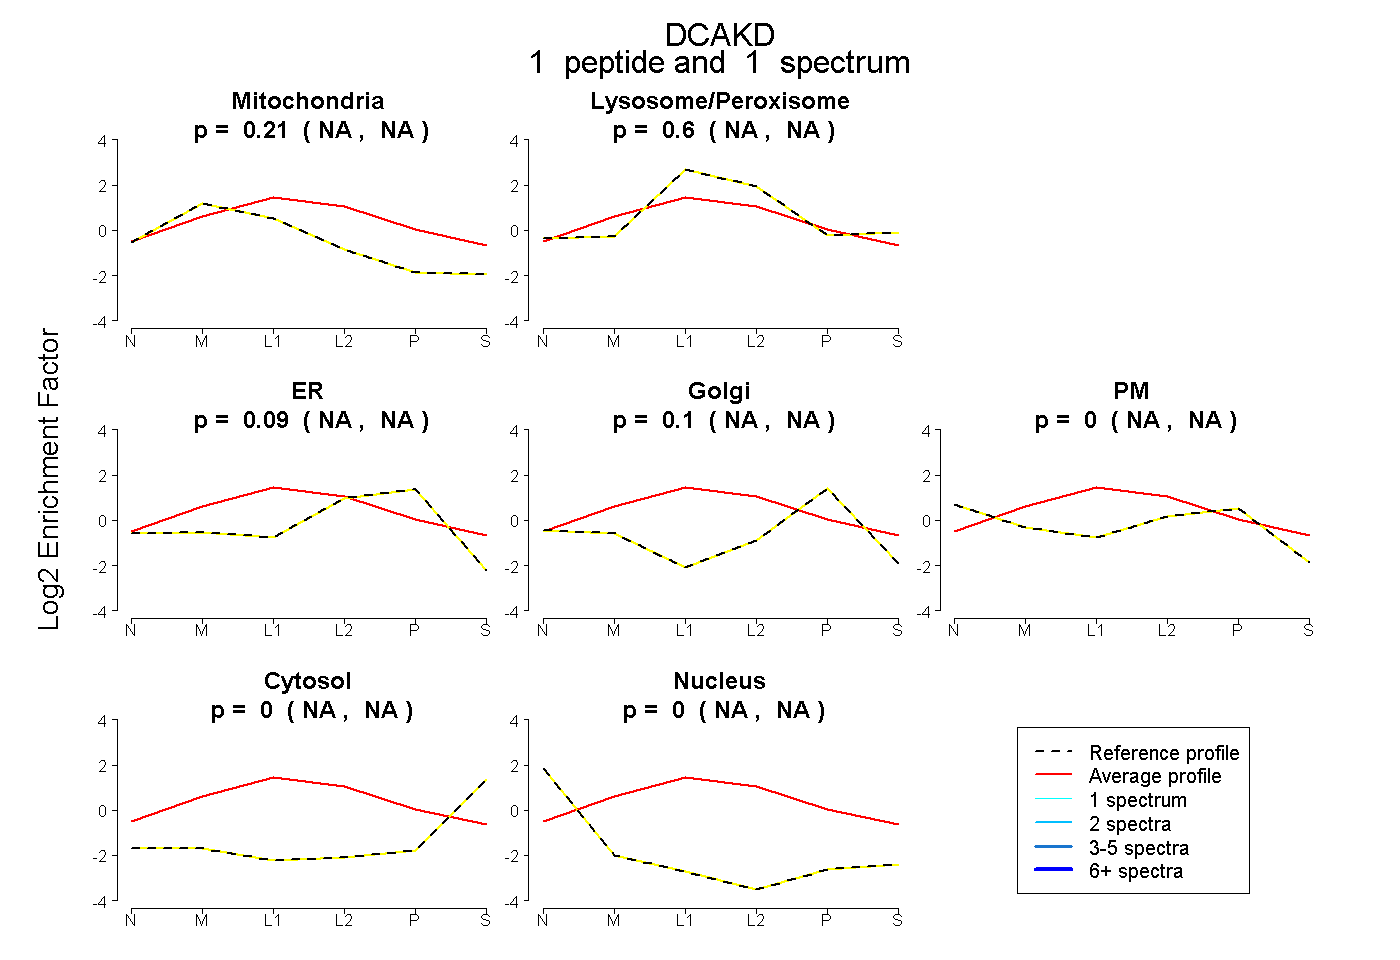 |
0.215 NA | NA |
0.603 NA | NA |
0.086 NA | NA |
0.097 NA | NA |
0.000 NA | NA |
0.000 NA | NA |
0.000 NA | NA |
|||
| Plot | Lyso | Other | |||||||||||
| Expt C |
10 peptides |
38 spectra |
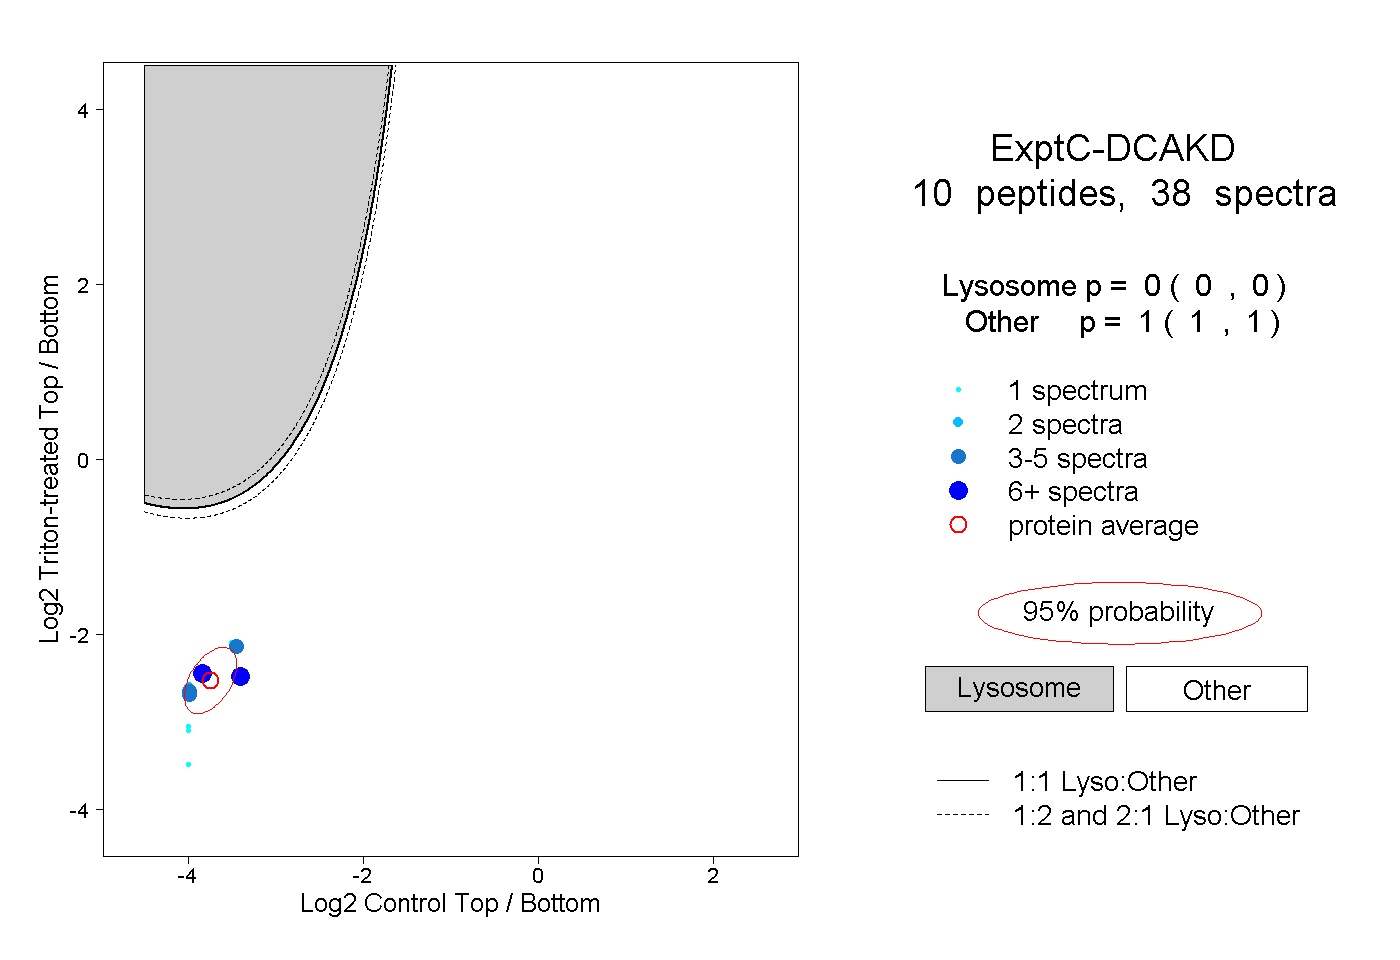 |
0.000 0.000 | 0.000 |
1.000 1.000 | 1.000 |
||||||||
| Plot | Lyso | Other | |||||||||||
| Expt D |
4 peptides |
5 spectra |
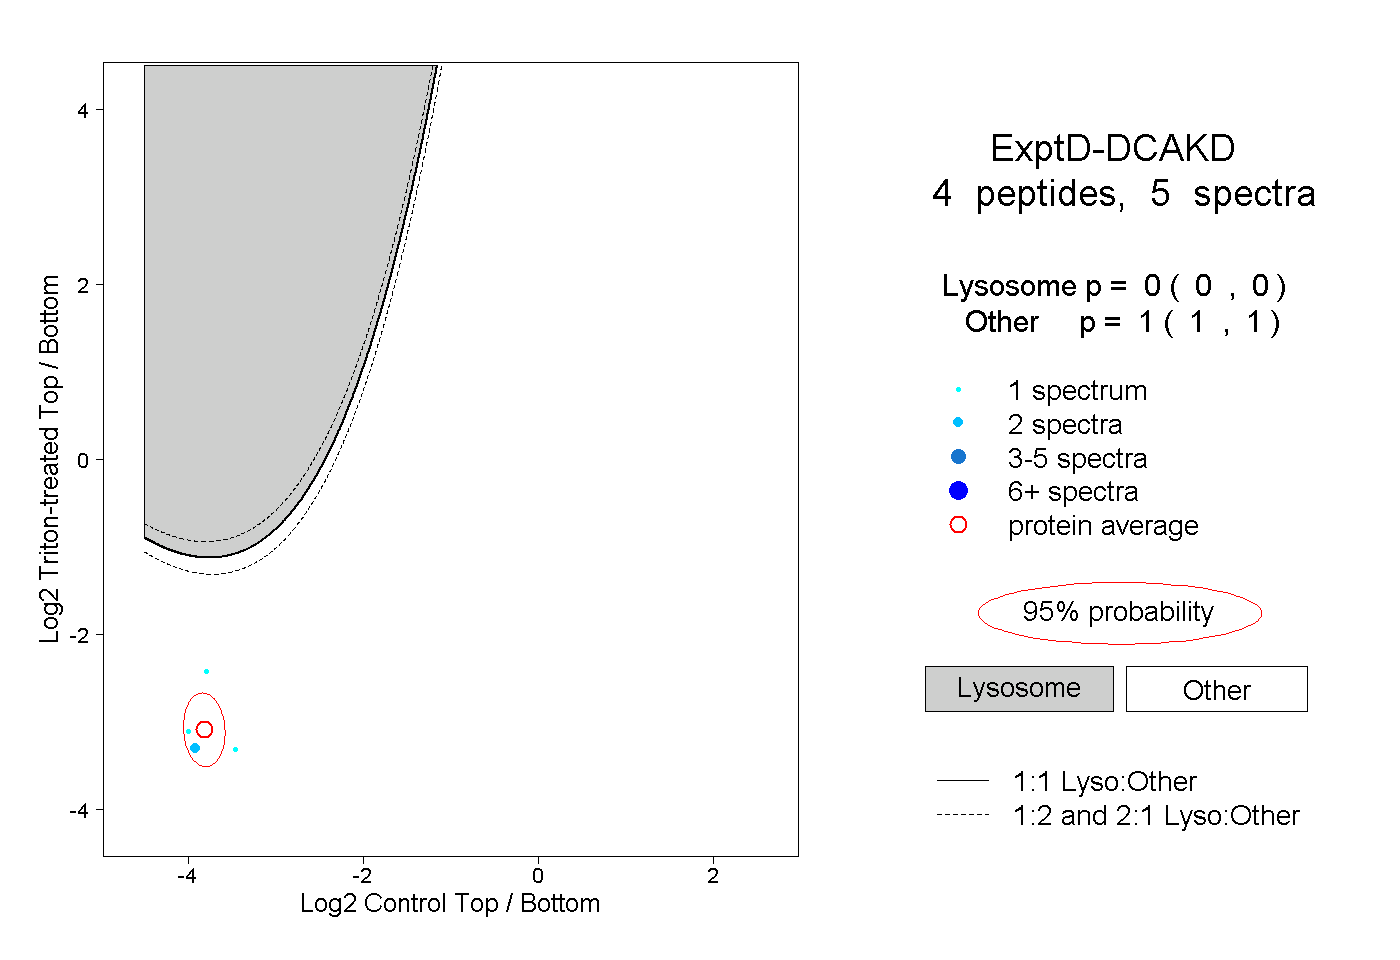 |
0.000 0.000 | 0.000 |
1.000 1.000 | 1.000 |