 3
3peptides
spectra
0.000 | 0.000
0.000 | 0.000
0.000 | 0.217
0.000 | 0.199
0.000 | 0.317
0.080 | 0.417
0.330 | 0.446
0.000 | 0.000
| Plot | Mito | Lyso | Perox | ER | Golgi | PM | Cytosol | Nucleus | |||||
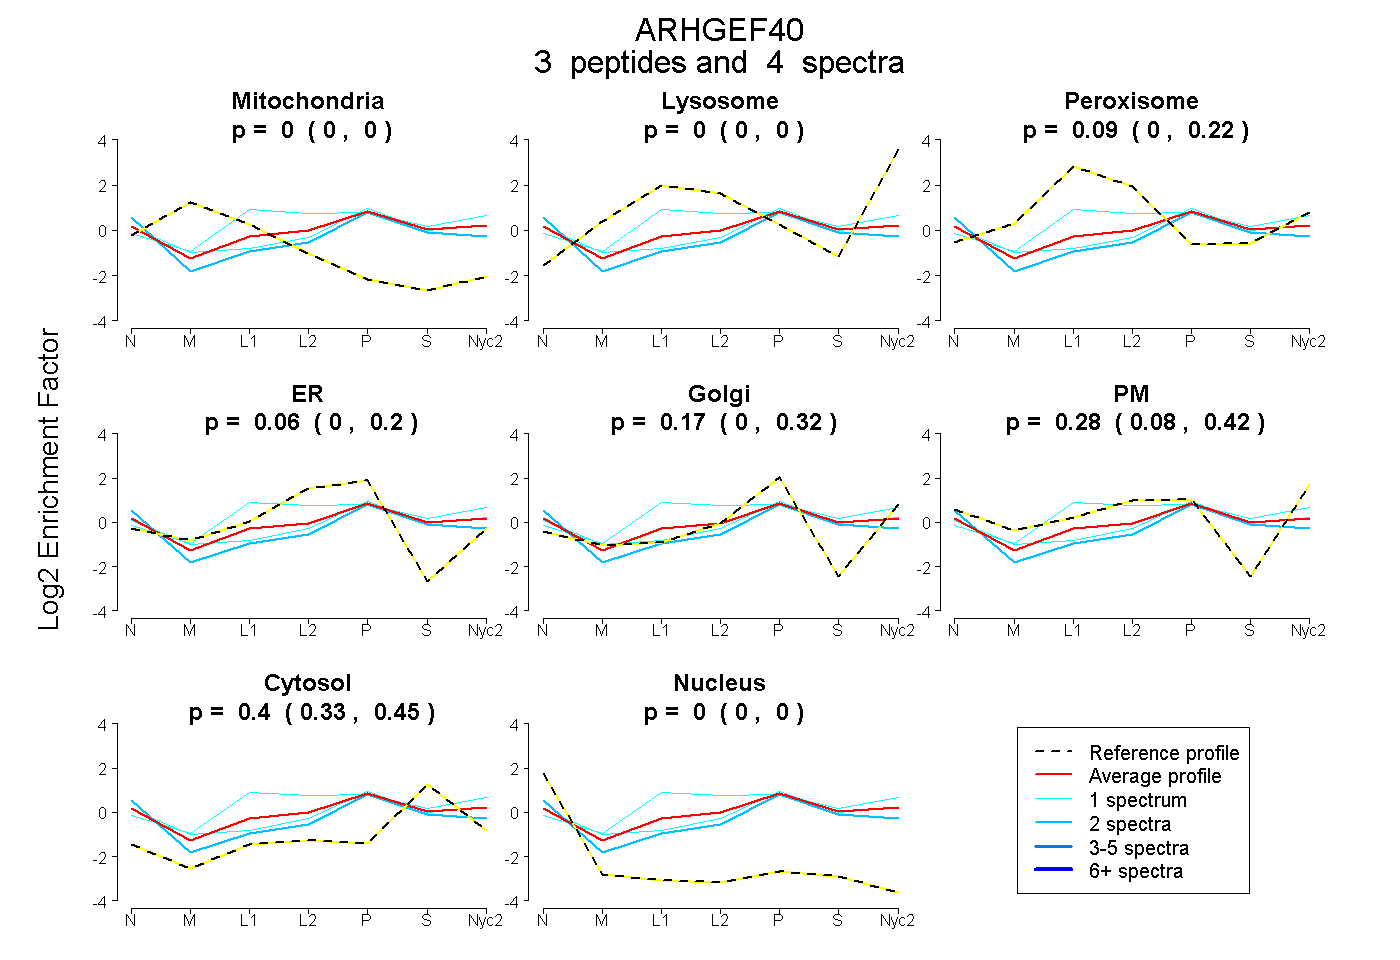
| Expt A |
3 peptides |
4 spectra |
|
0.000 0.000 | 0.000 |
0.000 0.000 | 0.000 |
0.090 0.000 | 0.217 |
0.062 0.000 | 0.199 |
0.167 0.000 | 0.317 |
0.281 0.080 | 0.417 |
0.400 0.330 | 0.446 |
0.000 0.000 | 0.000 |
| 2 spectra, GSPIDAEASGLSR | 0.000 | 0.000 | 0.000 | 0.059 | 0.253 | 0.194 | 0.437 | 0.057 | ||
| 1 spectrum, EAVLAALALR | 0.000 | 0.000 | 0.020 | 0.000 | 0.296 | 0.275 | 0.409 | 0.000 | ||
| 1 spectrum, EHVLLGR | 0.000 | 0.000 | 0.468 | 0.000 | 0.277 | 0.037 | 0.218 | 0.000 |
| Plot | Mito | Lyso or Perox | ER | Golgi | PM | Cytosol | Nucleus | ||||||
| Expt B |
1 peptide |
2 spectra |
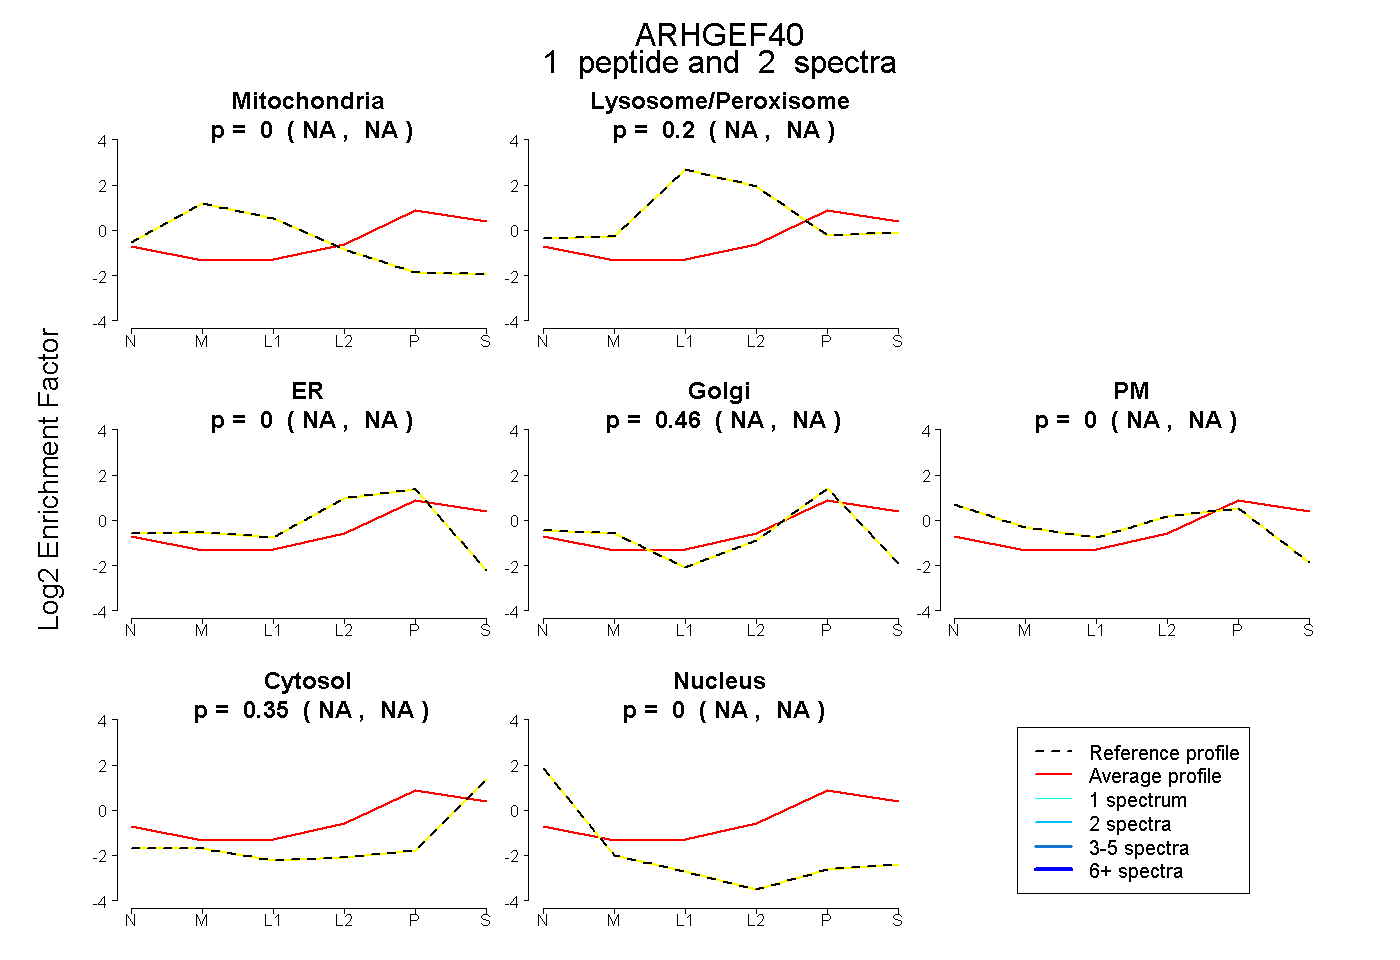 |
0.000 NA | NA |
0.195 NA | NA |
0.000 NA | NA |
0.458 NA | NA |
0.000 NA | NA |
0.347 NA | NA |
0.000 NA | NA |
|||
| Plot | Lyso | Other | |||||||||||
| Expt C |
4 peptides |
9 spectra |
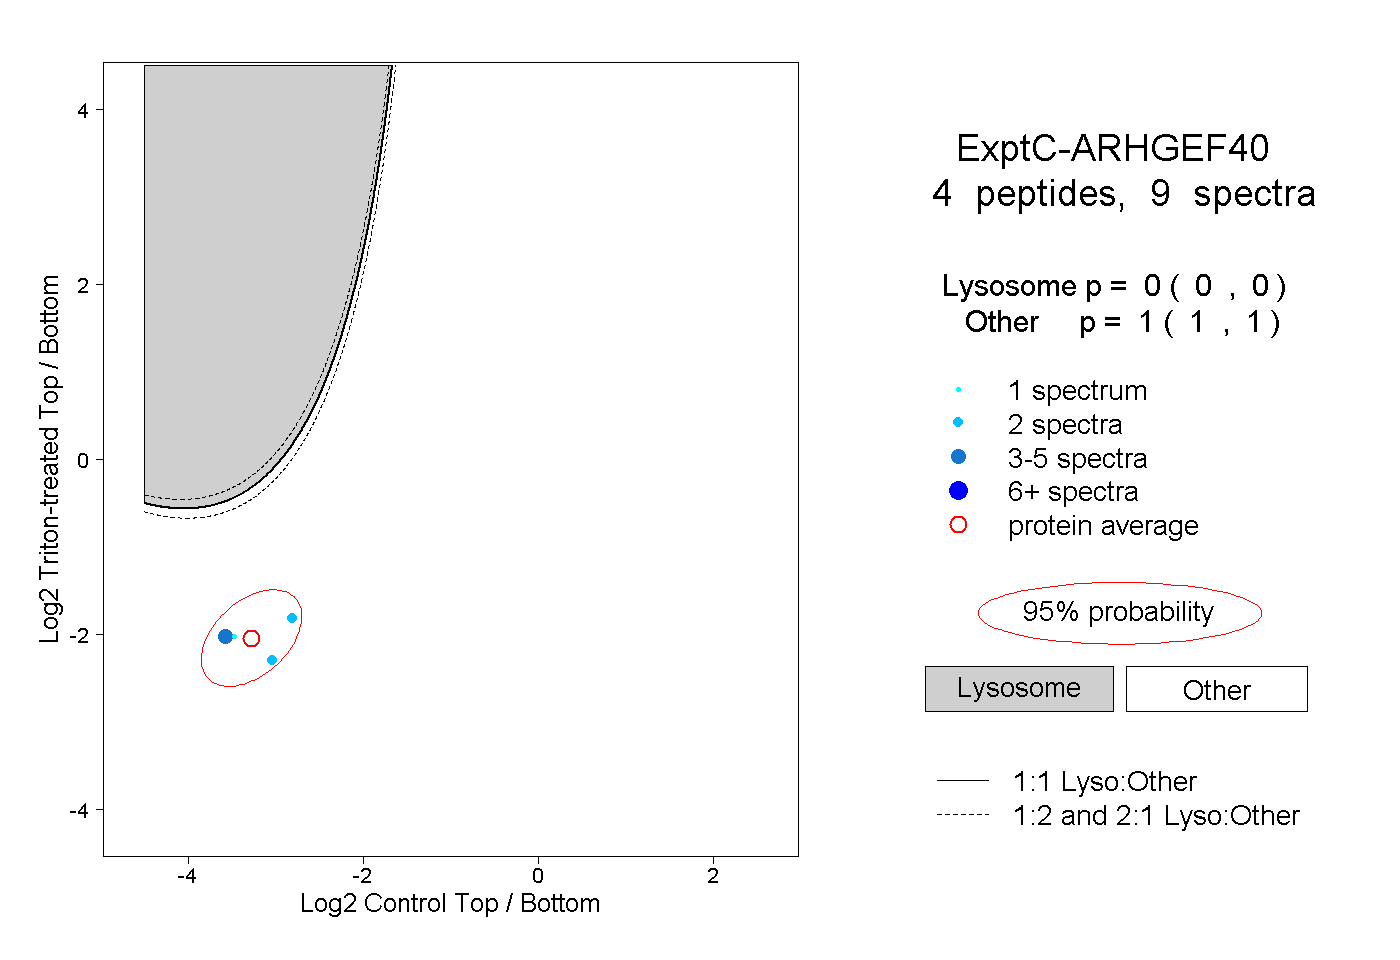 |
0.000 0.000 | 0.000 |
1.000 1.000 | 1.000 |