 3
3peptides
spectra
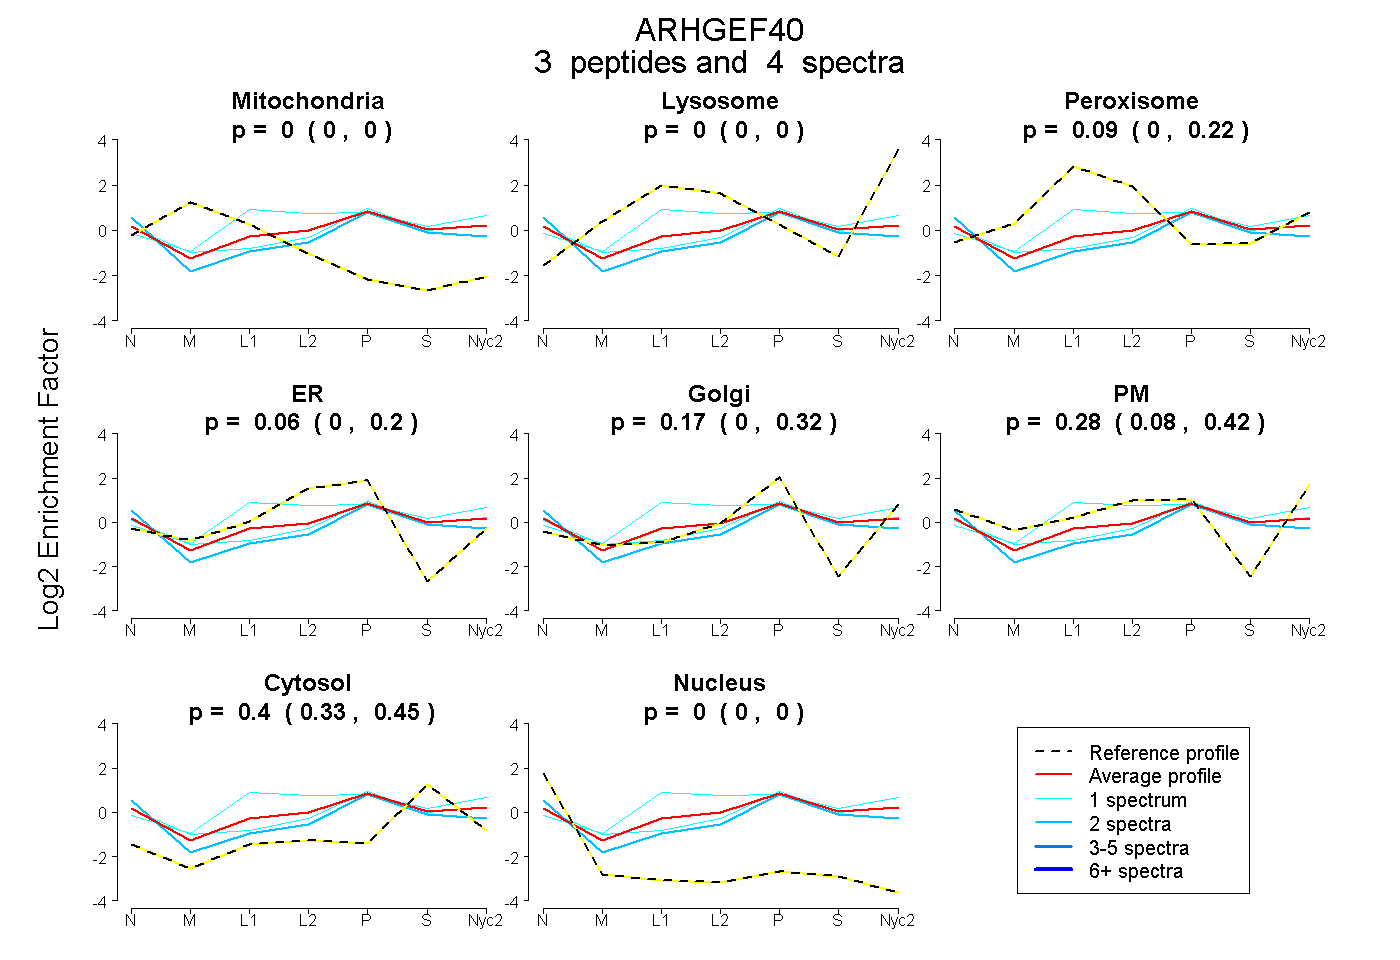
0.000 | 0.000
0.000 | 0.000
0.000 | 0.217
0.000 | 0.199
0.000 | 0.317
0.080 | 0.417
0.330 | 0.446
0.000 | 0.000
1peptide
spectra
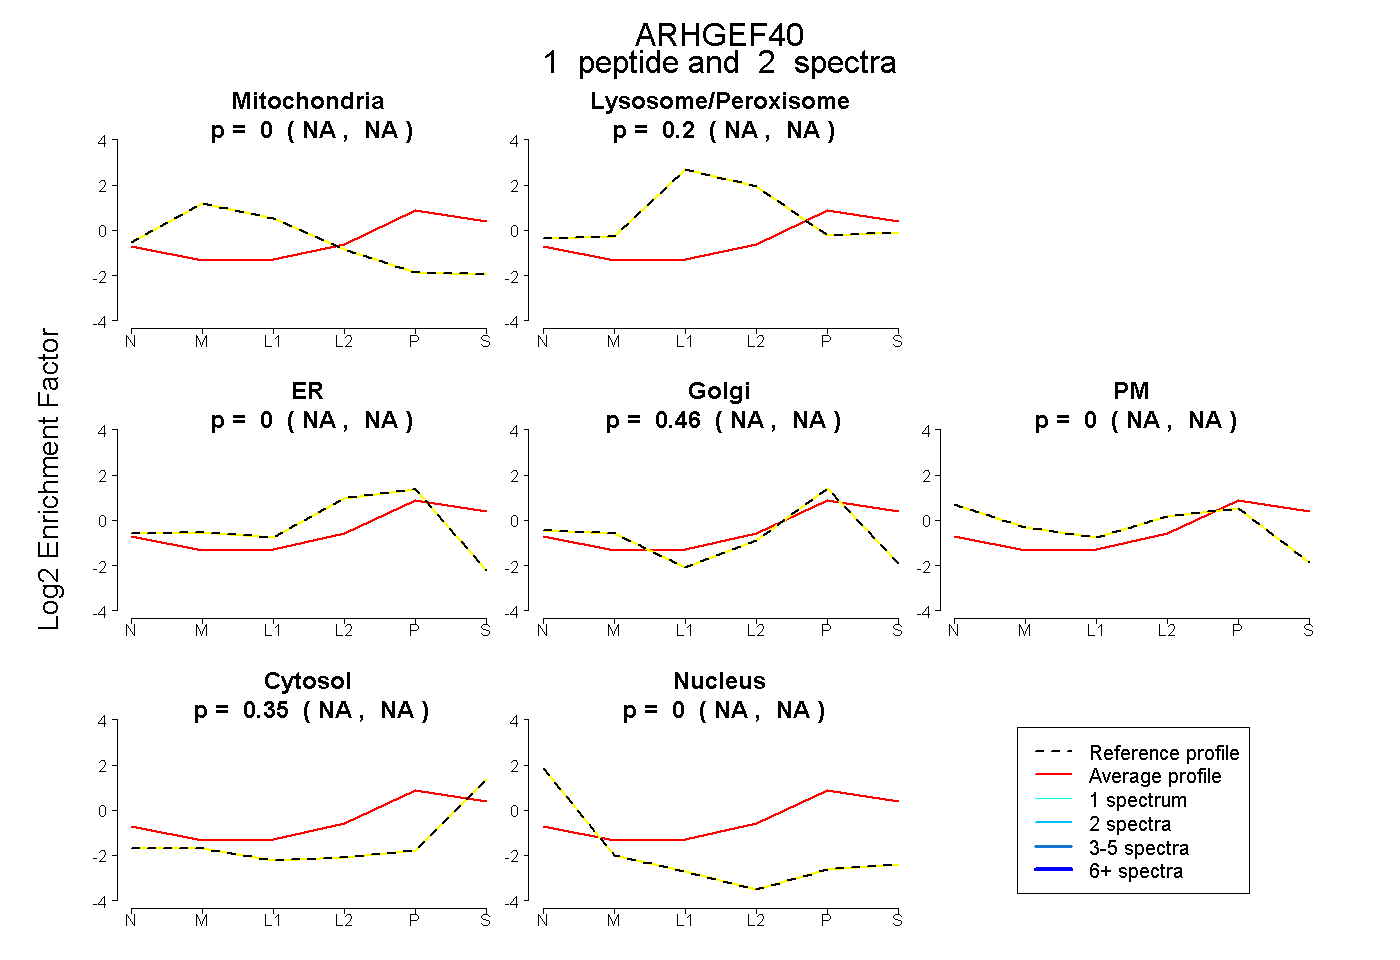
NA | NA
NA | NA
NA | NA
NA | NA
NA | NA
NA | NA
NA | NA
4peptides
spectra
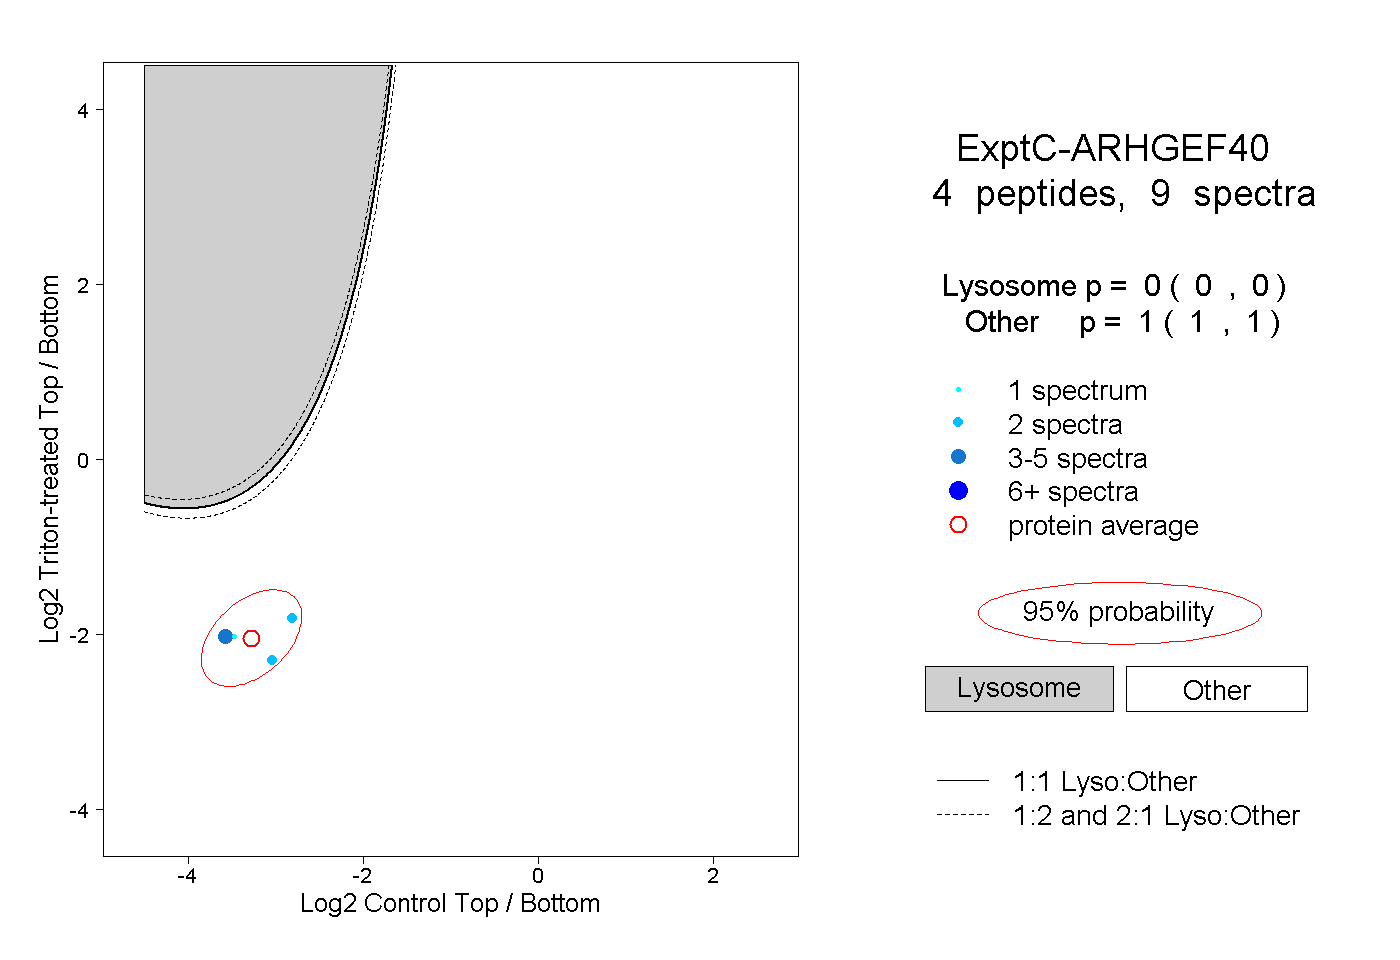
0.000 | 0.000
1.000 | 1.000