 4
4peptides
spectra
0.003 | 0.096
0.000 | 0.000
0.000 | 0.070
0.000 | 0.293
0.363 | 0.704
0.000 | 0.000
0.176 | 0.264
0.000 | 0.022
1peptide
spectra
0.001 | 1.000
0.000 | 0.999
| Plot | Mito | Lyso | Perox | ER | Golgi | PM | Cytosol | Nucleus | |||||
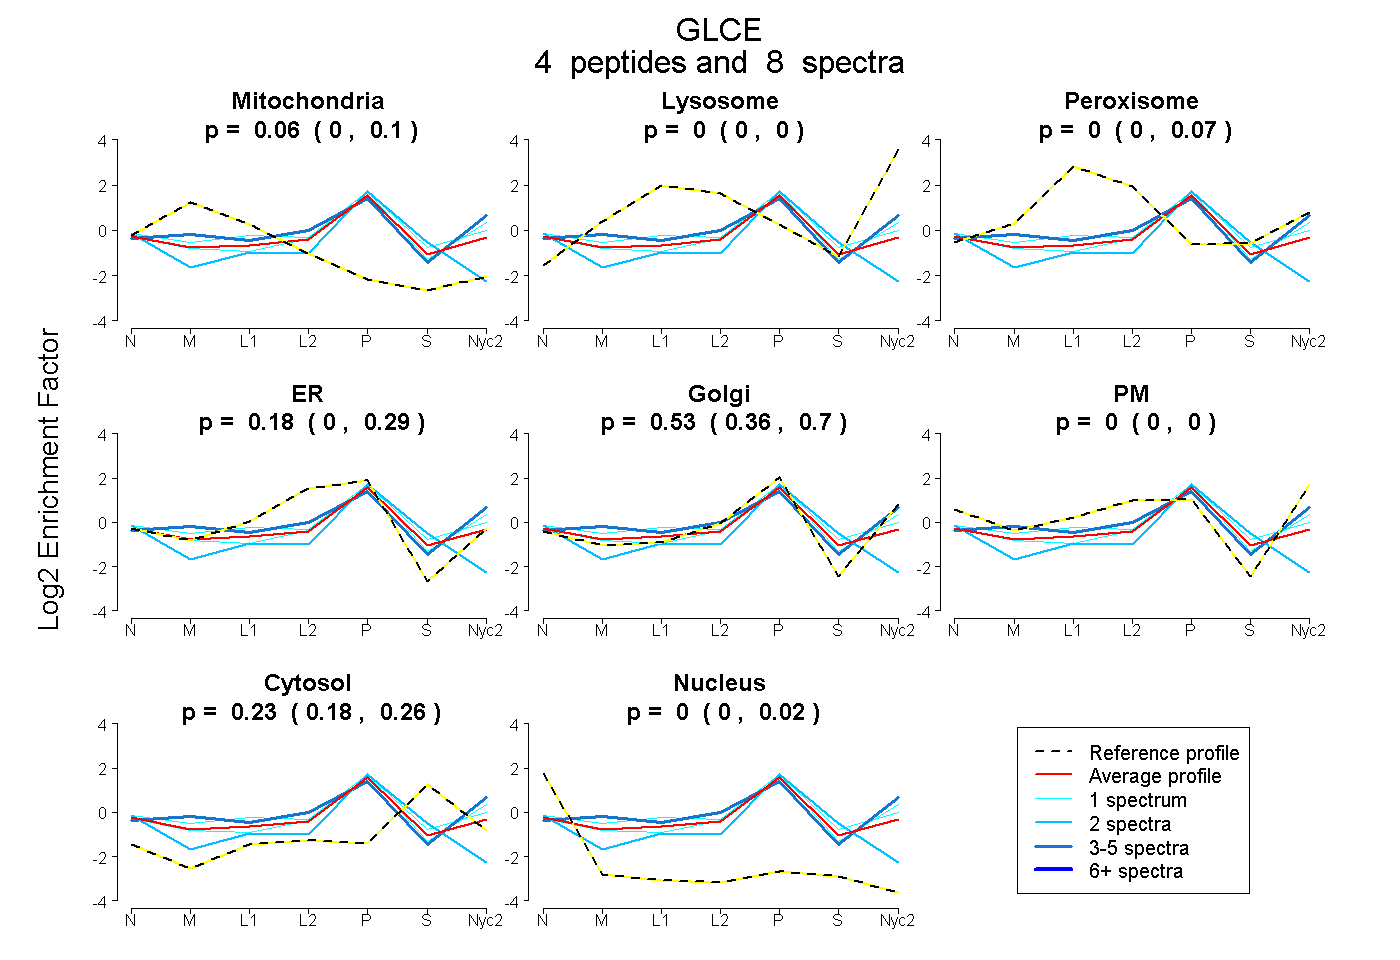
| Expt A |
4 peptides |
8 spectra |
|
0.061 0.003 | 0.096 |
0.000 0.000 | 0.000 |
0.000 0.000 | 0.070 |
0.177 0.000 | 0.293 |
0.531 0.363 | 0.704 |
0.000 0.000 | 0.000 |
0.231 0.176 | 0.264 |
0.000 0.000 | 0.022 |
||
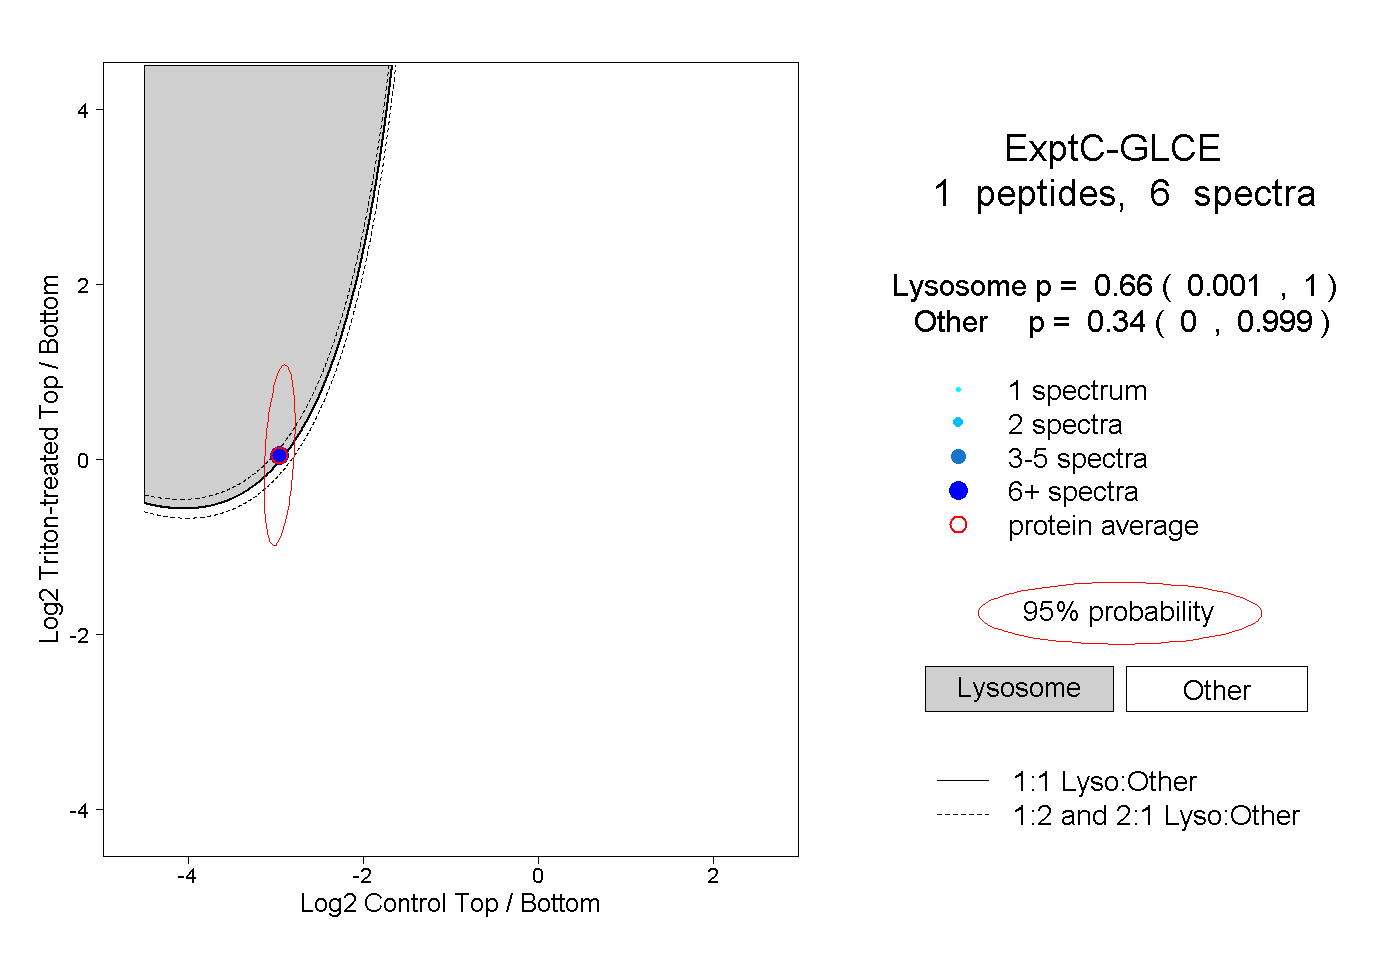
| Plot | Lyso | Other | |||||||||||
| Expt C |
1 peptide |
6 spectra |
|
0.660 0.001 | 1.000 |
0.340 0.000 | 0.999 |