 6
6peptides
spectra
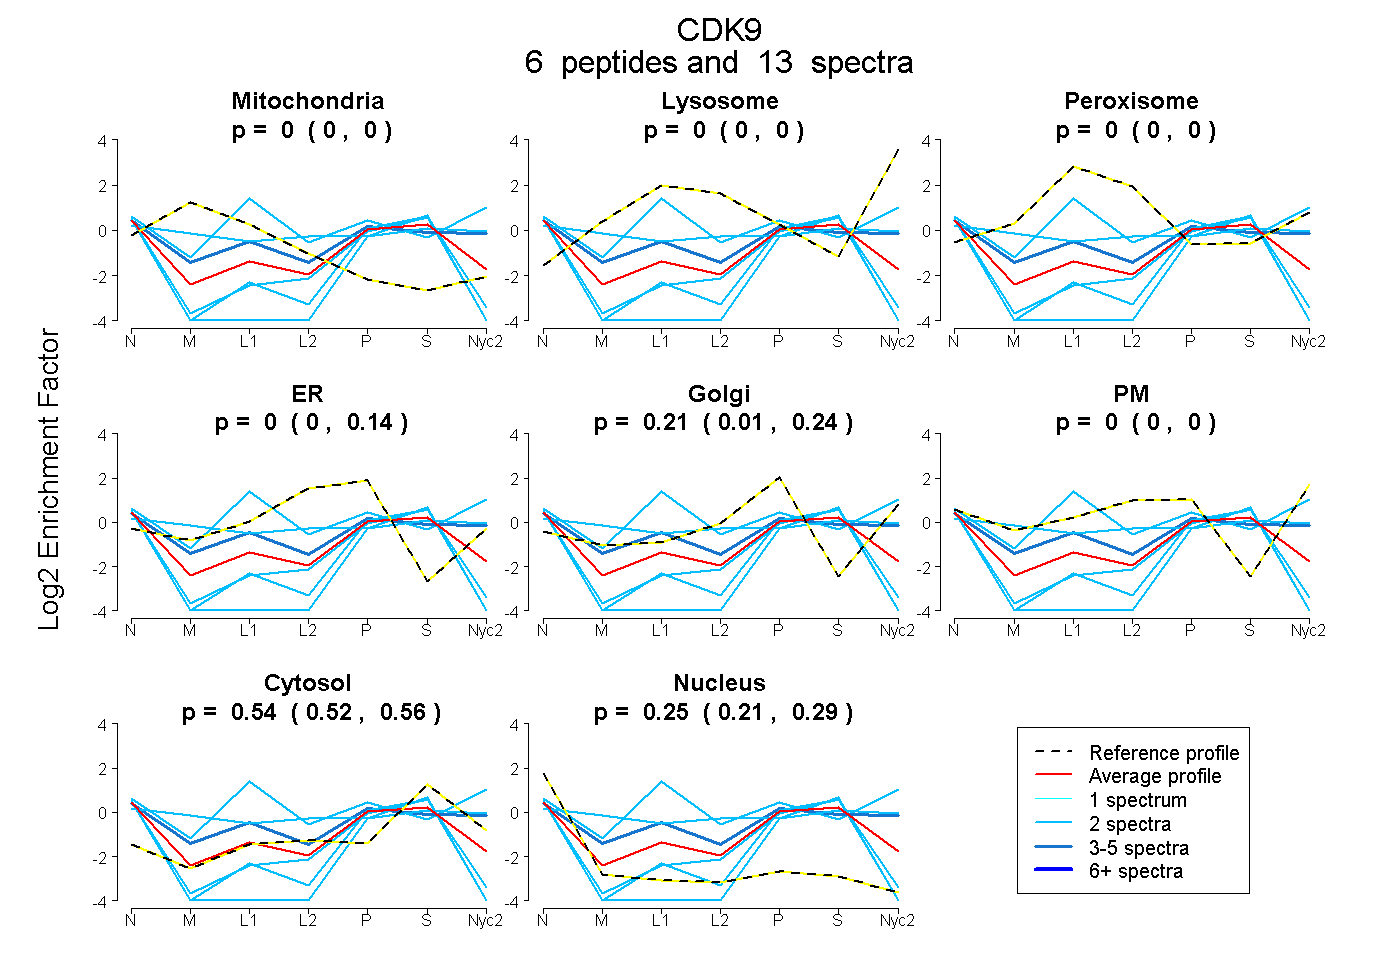
0.000 | 0.000
0.000 | 0.000
0.000 | 0.000
0.000 | 0.144
0.012 | 0.240
0.000 | 0.000
0.515 | 0.560
0.206 | 0.290
| Plot | Mito | Lyso | Perox | ER | Golgi | PM | Cytosol | Nucleus | |||||
| Expt A |
6 peptides |
13 spectra |
|
0.000 0.000 | 0.000 |
0.000 0.000 | 0.000 |
0.000 0.000 | 0.000 |
0.001 0.000 | 0.144 |
0.209 0.012 | 0.240 |
0.000 0.000 | 0.000 |
0.539 0.515 | 0.560 |
0.252 0.206 | 0.290 |
| 2 spectra, NPATTNQTEFER | 0.000 | 0.000 | 0.000 | 0.000 | 0.000 | 0.000 | 0.539 | 0.461 | ||
| 2 spectra, DPYALDLIDK | 0.000 | 0.000 | 0.000 | 0.000 | 0.000 | 0.000 | 0.543 | 0.457 | ||
| 2 spectra, HENVVNLIEICR | 0.150 | 0.000 | 0.095 | 0.000 | 0.000 | 0.338 | 0.417 | 0.000 | ||
| 2 spectra, AANVLITR | 0.000 | 0.000 | 0.277 | 0.000 | 0.000 | 0.435 | 0.288 | 0.000 | ||
| 2 spectra, QYDSVECPFCDEVTK | 0.000 | 0.000 | 0.000 | 0.000 | 0.000 | 0.000 | 0.402 | 0.598 | ||
| 3 spectra, GSQITQQSTNQSR | 0.000 | 0.000 | 0.024 | 0.000 | 0.099 | 0.307 | 0.469 | 0.101 |
| Plot | Mito | Lyso or Perox | ER | Golgi | PM | Cytosol | Nucleus | ||||||
| Expt B |
1 peptide |
1 spectrum |
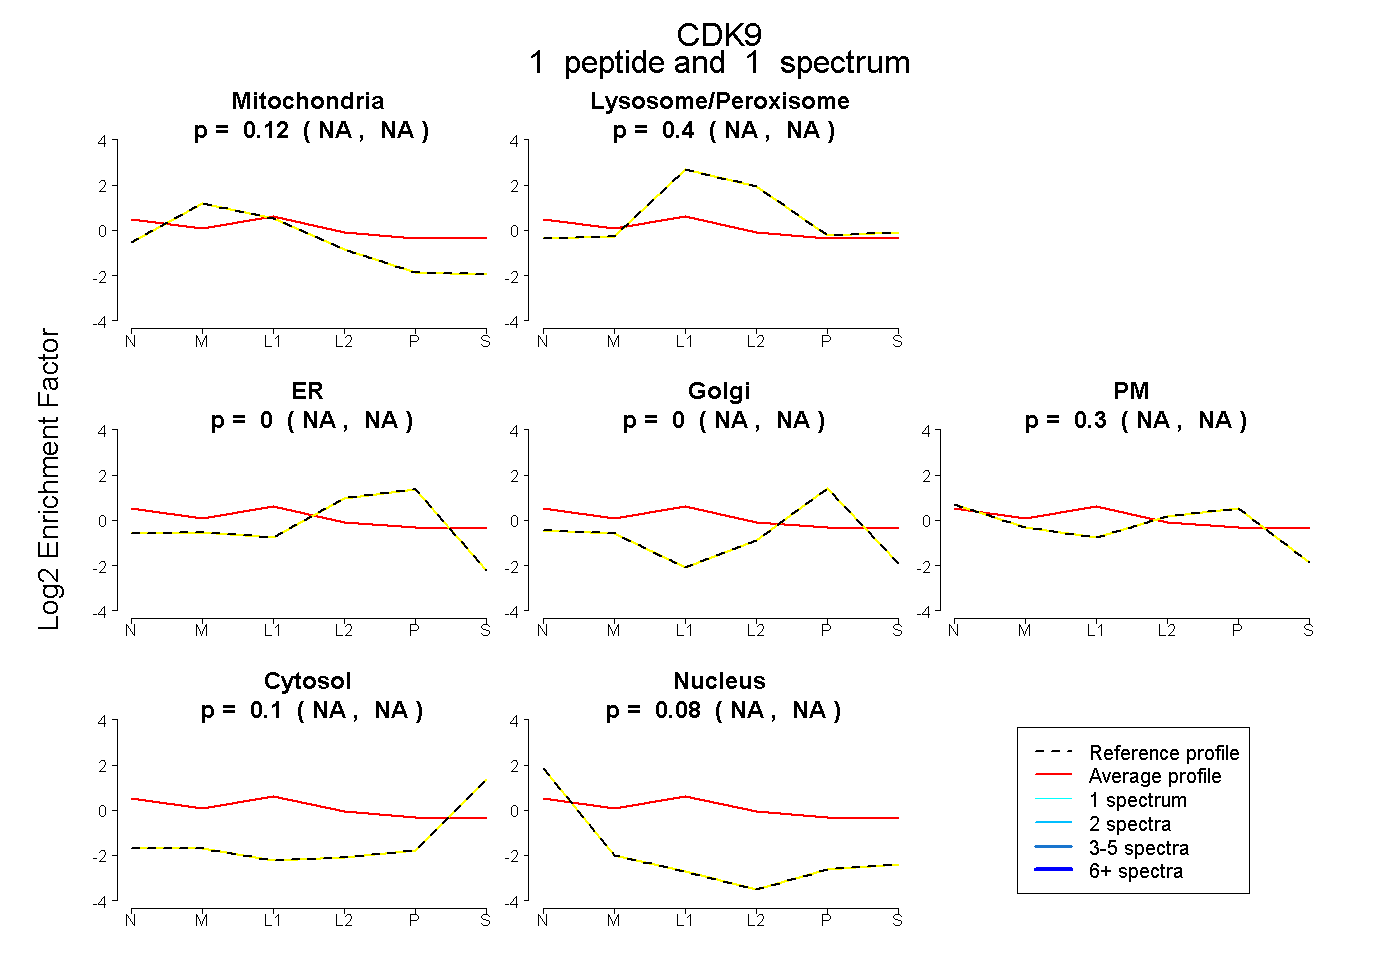 |
0.121 NA | NA |
0.404 NA | NA |
0.000 NA | NA |
0.000 NA | NA |
0.298 NA | NA |
0.101 NA | NA |
0.076 NA | NA |
|||
| Plot | Lyso | Other | |||||||||||
| Expt D |
1 peptide |
1 spectrum |
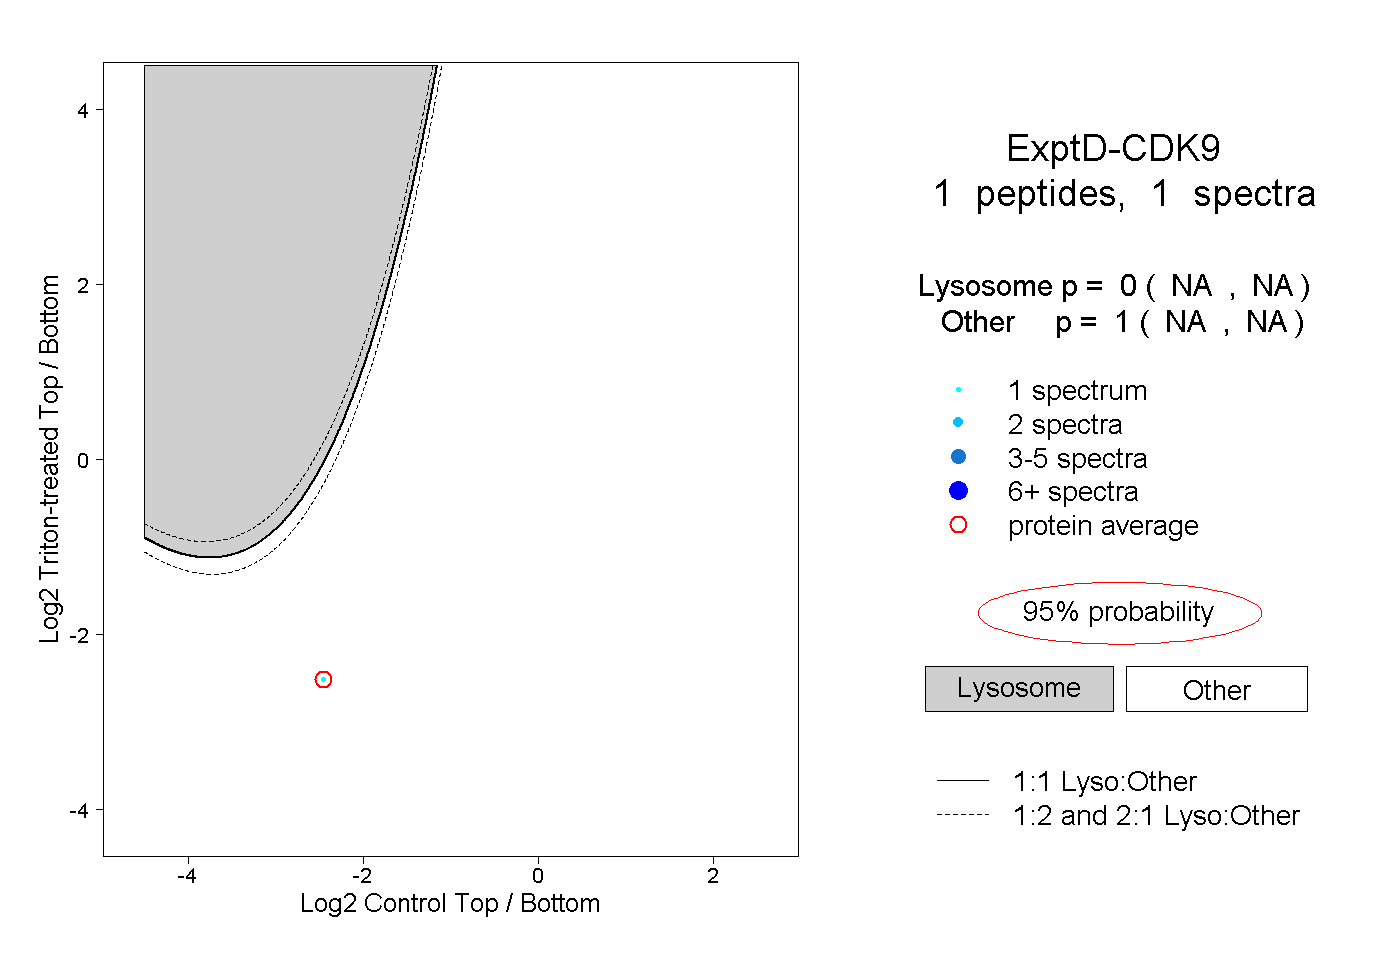 |
0.000 NA | NA |
1.000 NA | NA |