 2
2peptides
spectra
0.000 | 0.000
0.000 | 0.043
0.100 | 0.251
0.000 | 0.252
0.128 | 0.442
0.000 | 0.181
0.303 | 0.400
0.000 | 0.000
2peptides
spectra
0.000 | 0.000
1.000 | 1.000
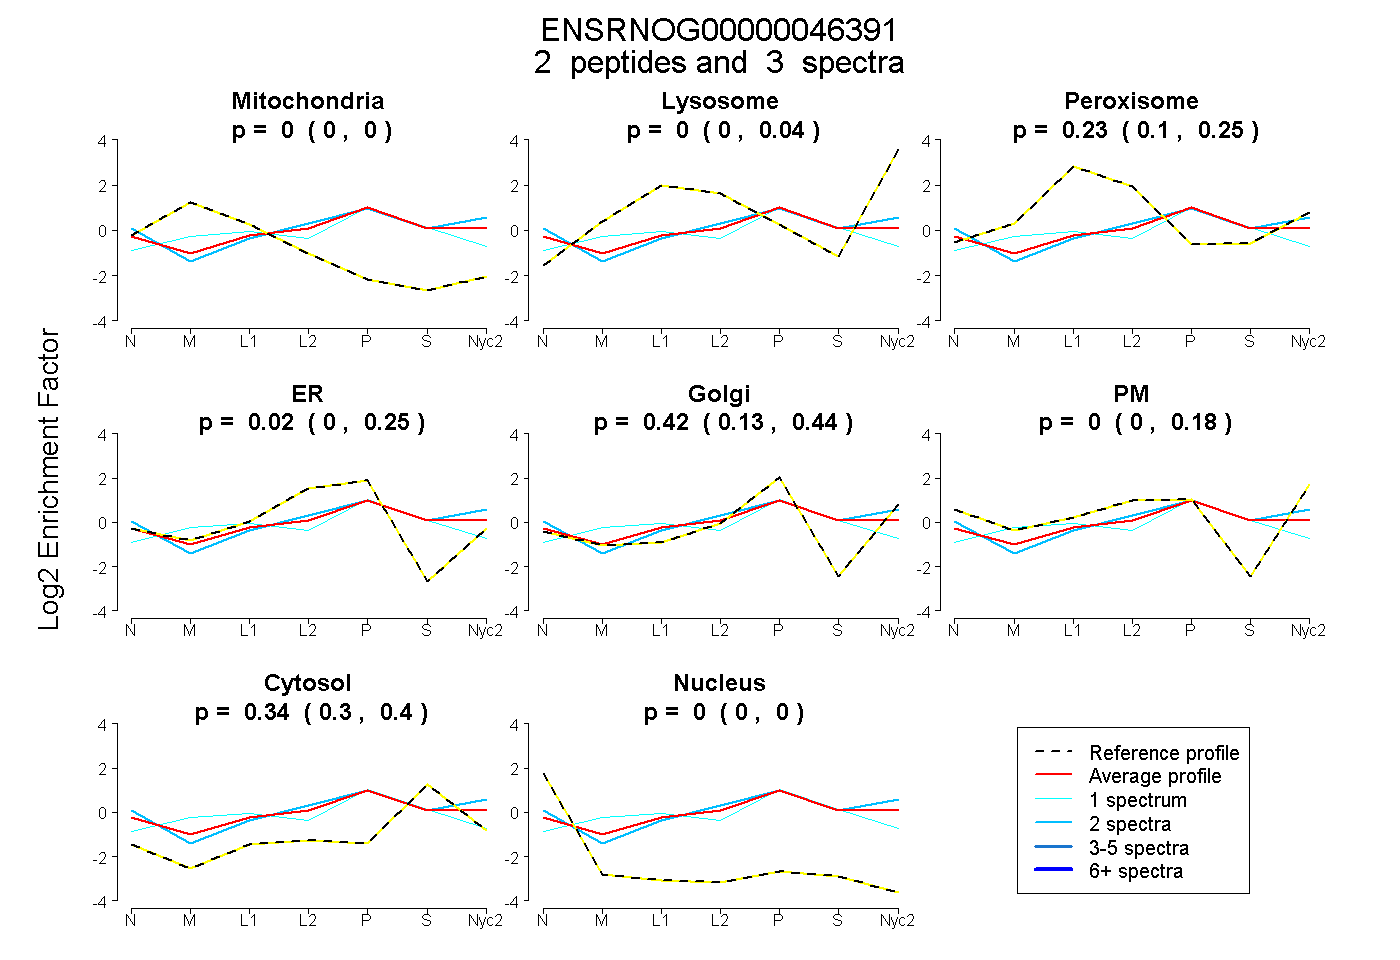
| Plot | Mito | Lyso | Perox | ER | Golgi | PM | Cytosol | Nucleus | |||||
| Expt A |
2 peptides |
3 spectra |
|
0.000 0.000 | 0.000 |
0.000 0.000 | 0.043 |
0.227 0.100 | 0.251 |
0.019 0.000 | 0.252 |
0.418 0.128 | 0.442 |
0.000 0.000 | 0.181 |
0.336 0.303 | 0.400 |
0.000 0.000 | 0.000 |
||
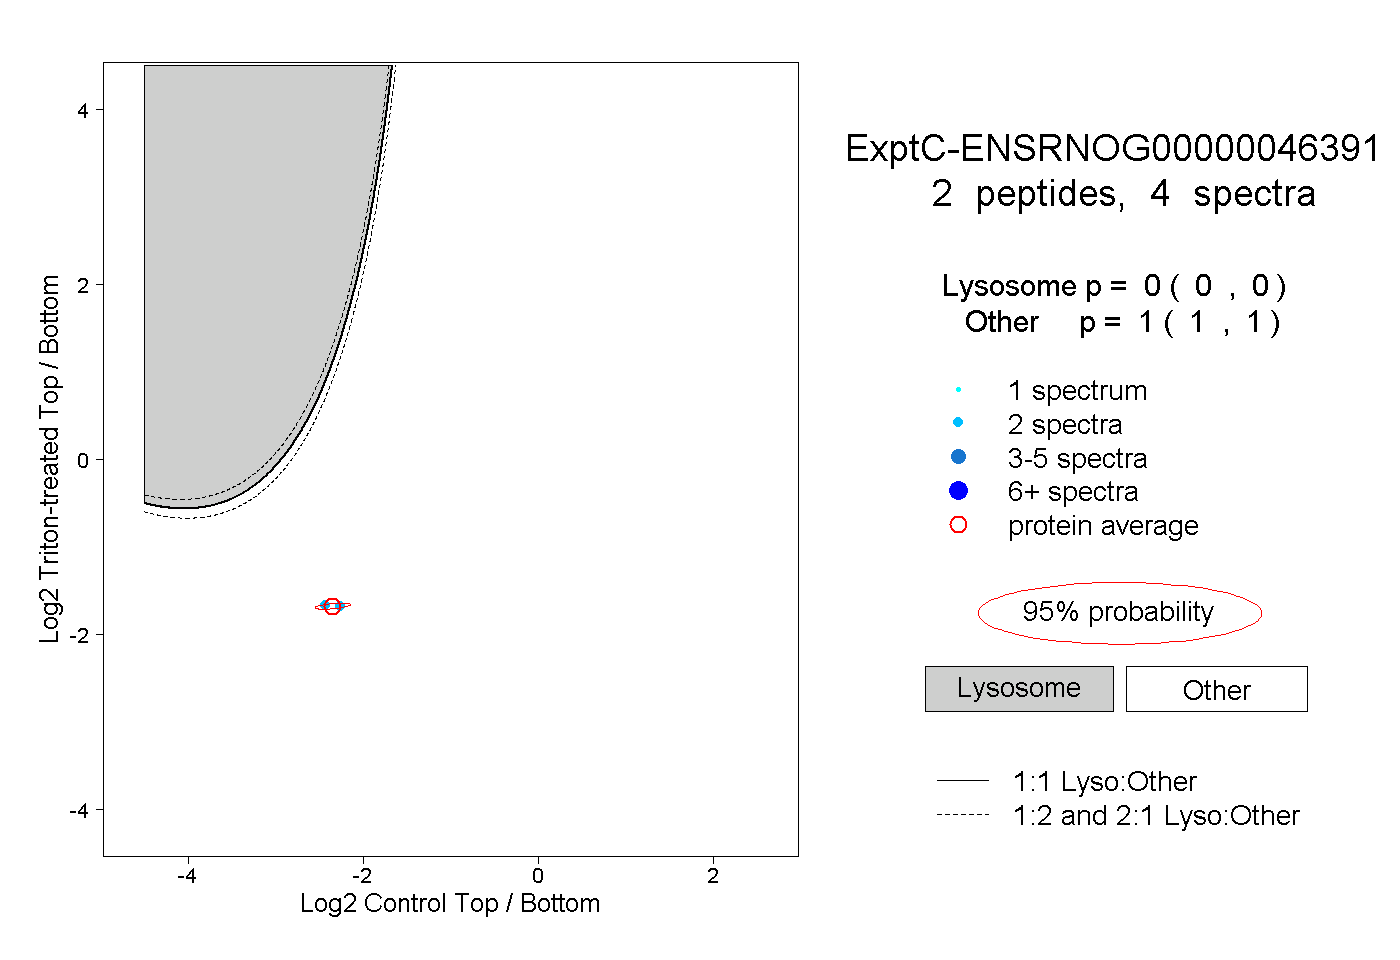
| Plot | Lyso | Other | |||||||||||
| Expt C |
2 peptides |
4 spectra |
|
0.000 0.000 | 0.000 |
1.000 1.000 | 1.000 |