 1
1peptide
spectra
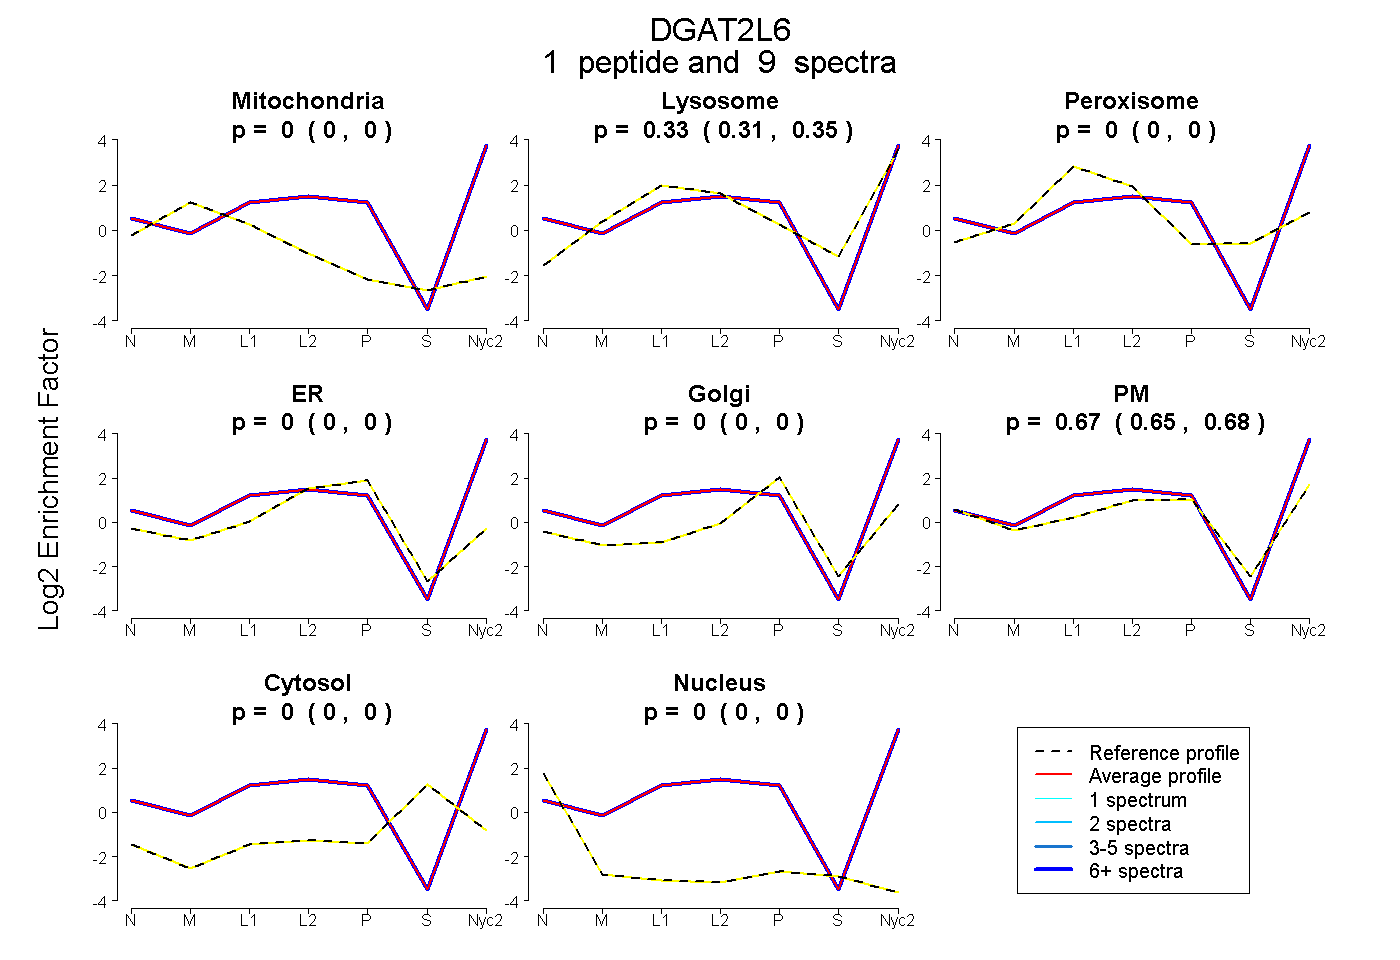
0.000 | 0.000
0.312 | 0.347
0.000 | 0.000
0.000 | 0.000
0.000 | 0.000
0.650 | 0.684
0.000 | 0.000
0.000 | 0.000
2peptides
spectra
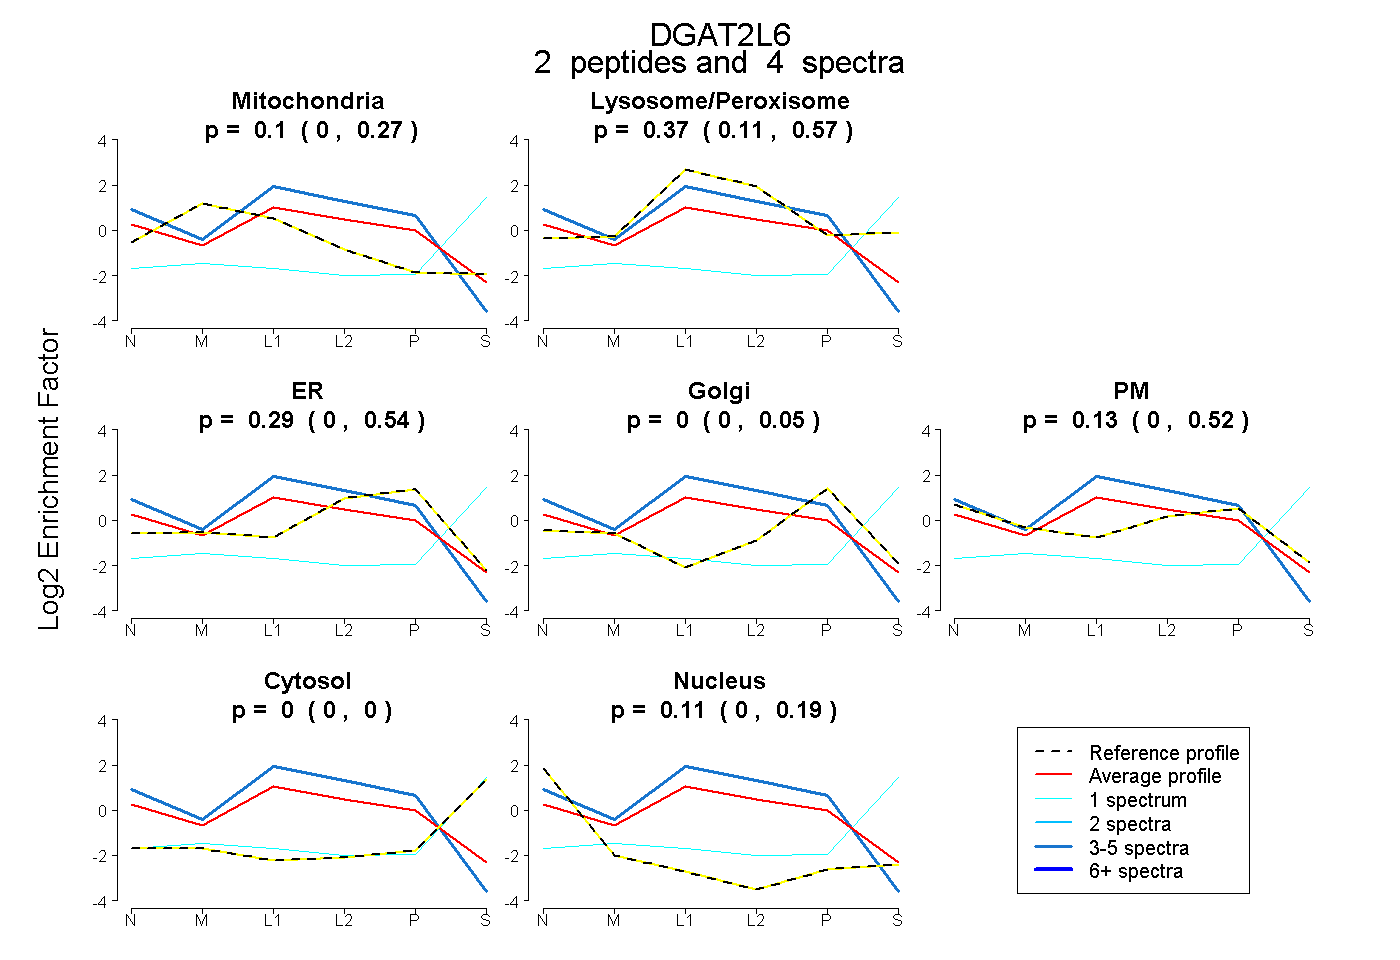
0.000 | 0.269
0.108 | 0.569
0.000 | 0.543
0.000 | 0.047
0.000 | 0.524
0.000 | 0.000
0.000 | 0.189
1peptide
spectra
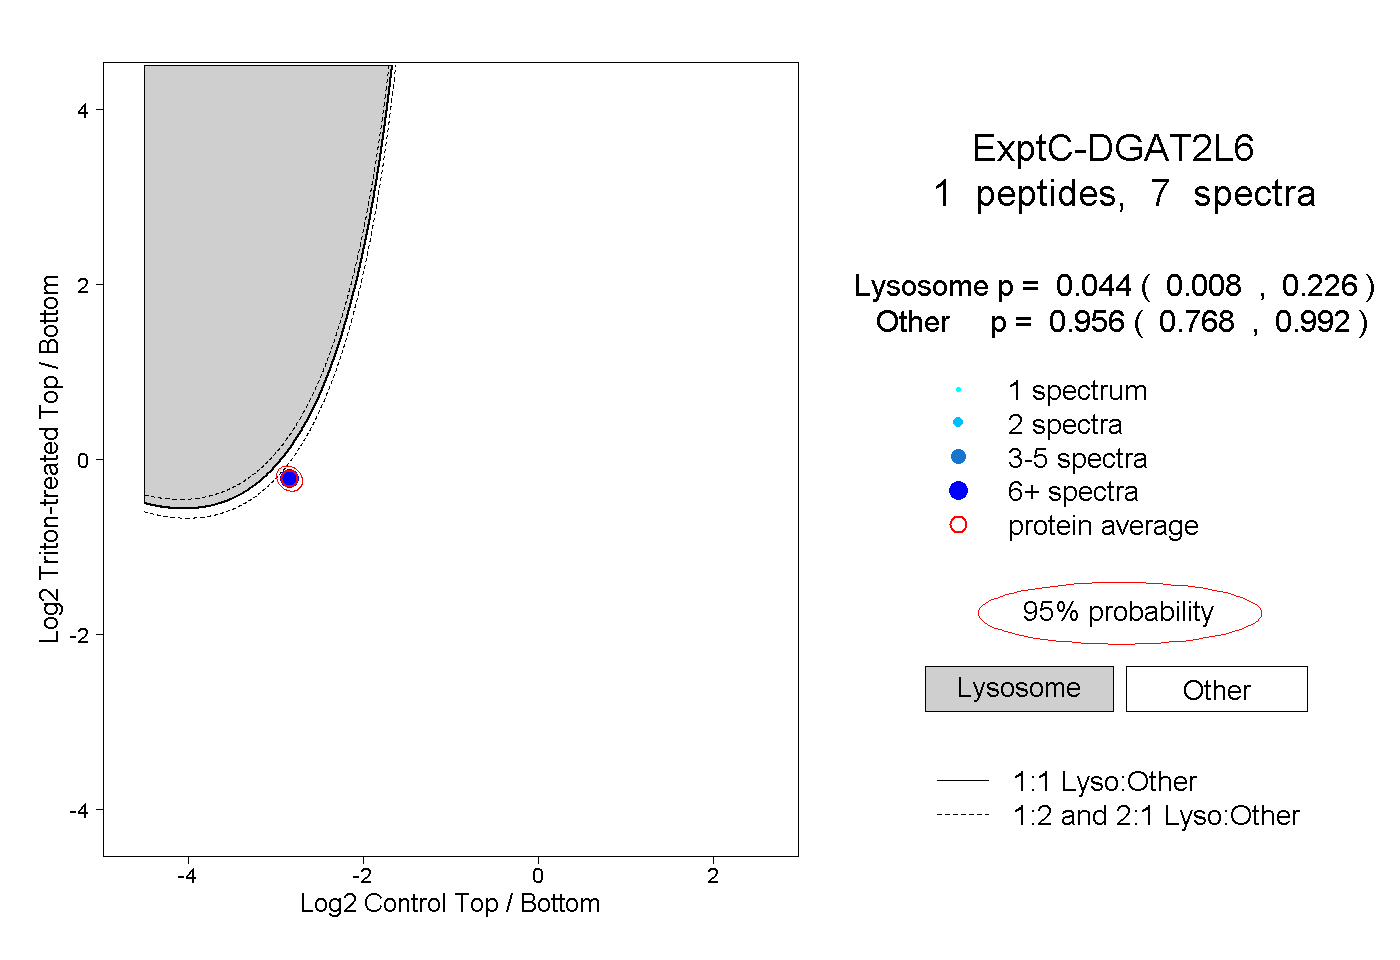
0.008 | 0.226
0.768 | 0.992