 2
2peptides
spectra
0.000 | 0.000
0.000 | 0.204
0.000 | 0.013
0.000 | 0.097
0.000 | 0.434
0.000 | 0.262
0.443 | 0.820
0.000 | 0.175
1peptide
spectrum
NA | NA
NA | NA
| Plot | Mito | Lyso | Perox | ER | Golgi | PM | Cytosol | Nucleus | |||||
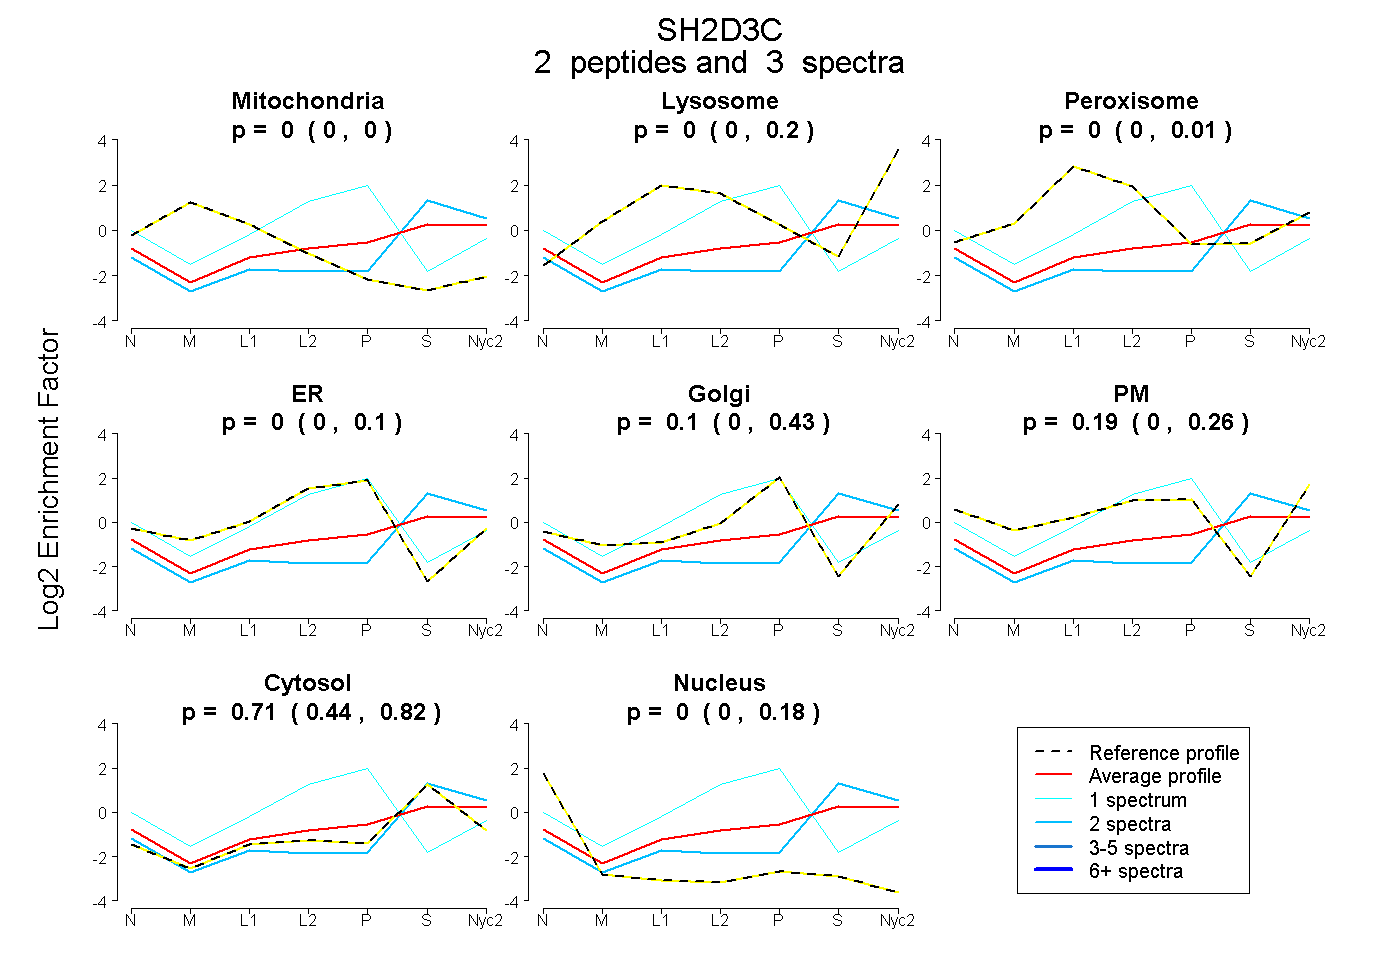
| Expt A |
2 peptides |
3 spectra |
|
0.000 0.000 | 0.000 |
0.000 0.000 | 0.204 |
0.000 0.000 | 0.013 |
0.000 0.000 | 0.097 |
0.096 0.000 | 0.434 |
0.193 0.000 | 0.262 |
0.711 0.443 | 0.820 |
0.000 0.000 | 0.175 |
||
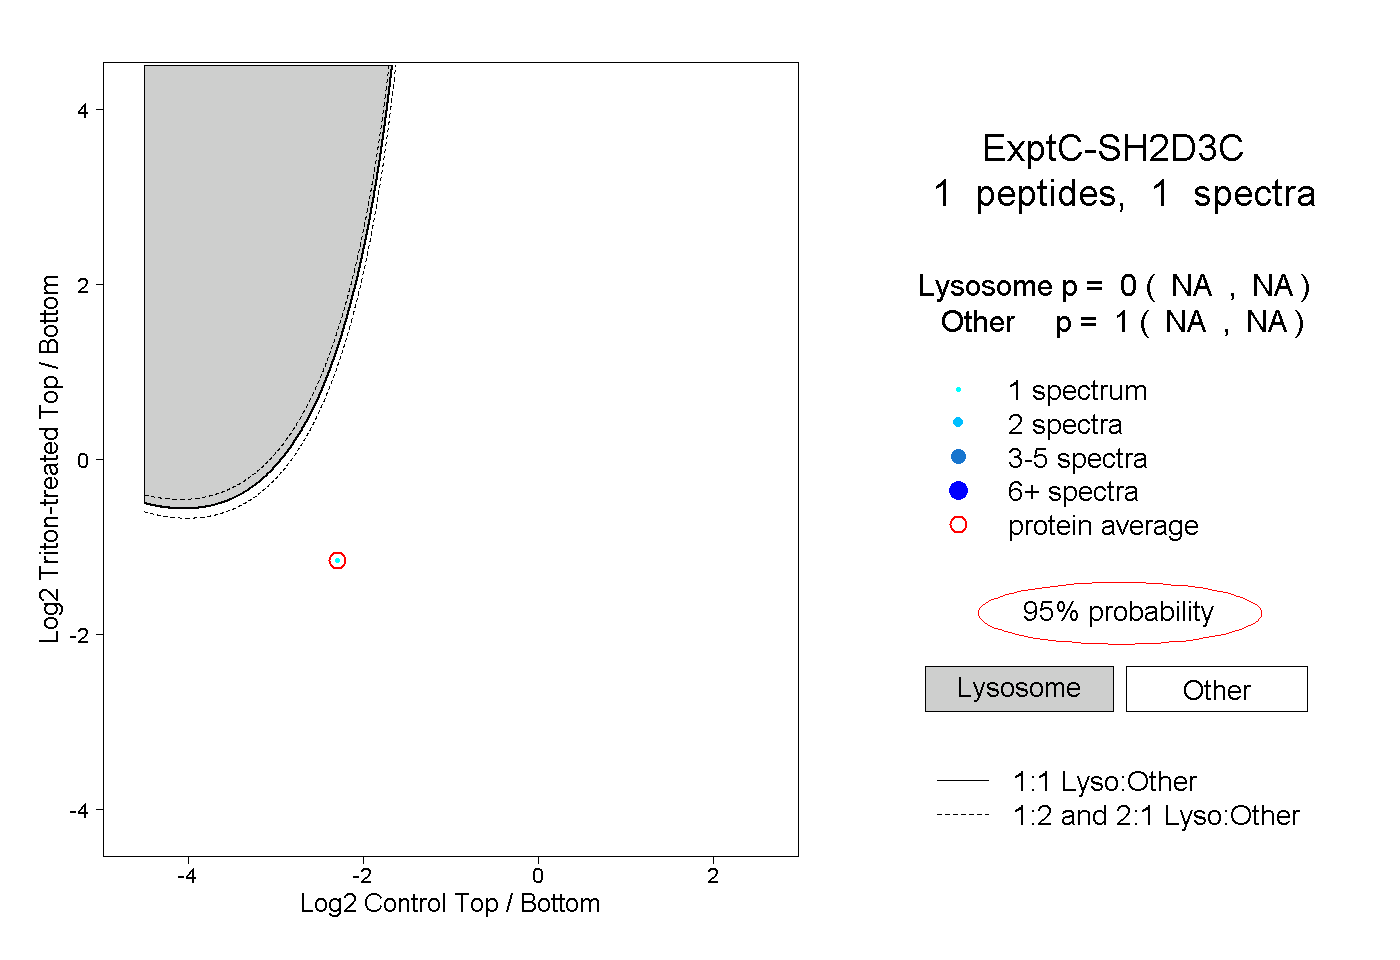
| Plot | Lyso | Other | |||||||||||
| Expt C |
1 peptide |
1 spectrum |
|
0.000 NA | NA |
1.000 NA | NA |