 5
5peptides
spectra
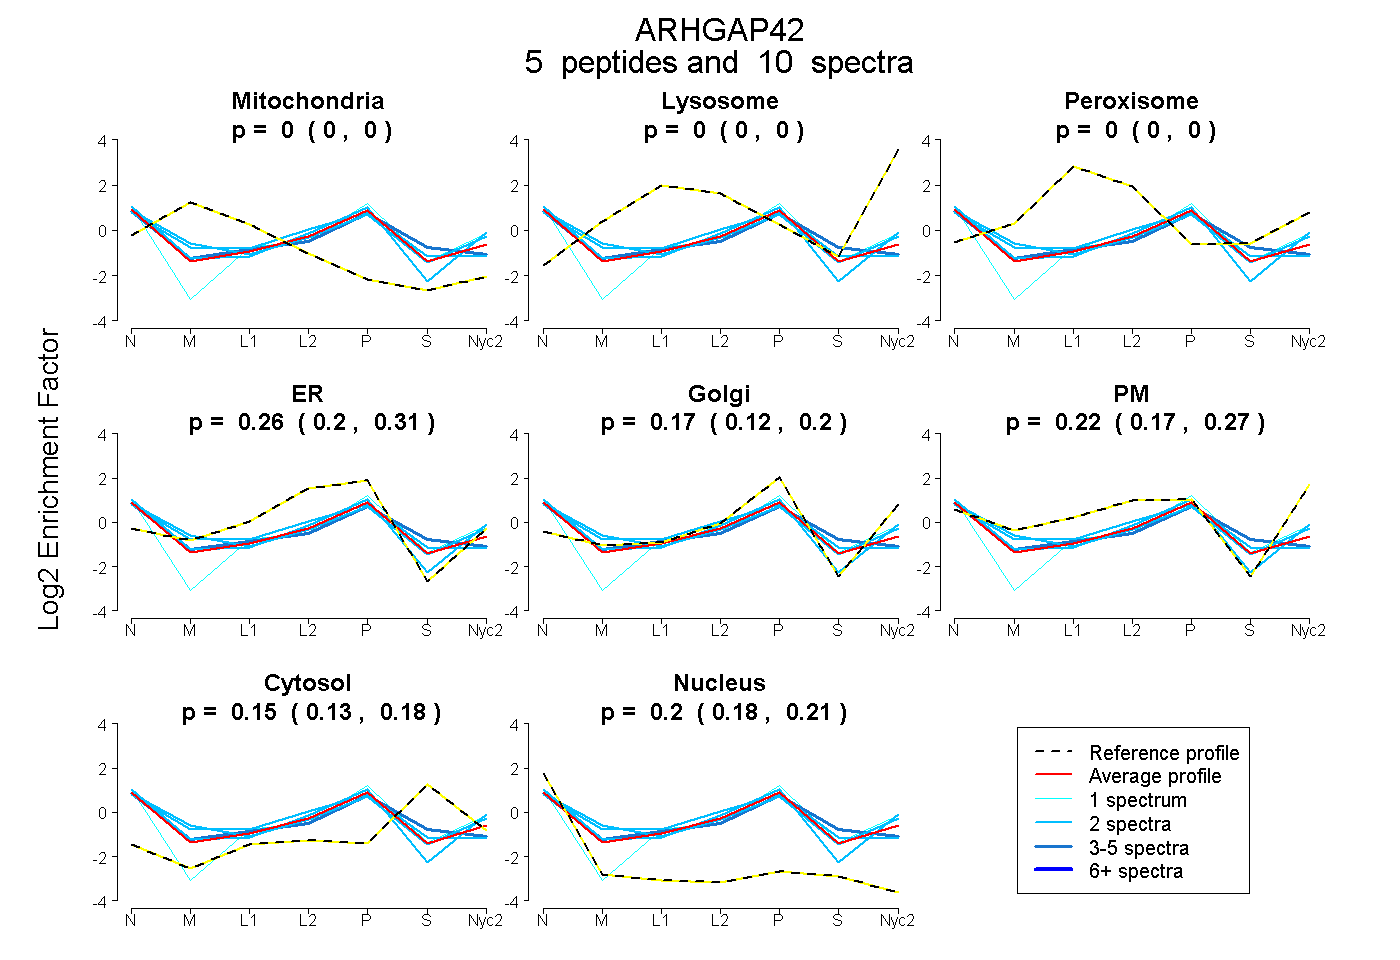
0.000 | 0.000
0.000 | 0.000
0.000 | 0.000
0.200 | 0.313
0.120 | 0.204
0.166 | 0.267
0.126 | 0.178
0.180 | 0.212
| Plot | Mito | Lyso | Perox | ER | Golgi | PM | Cytosol | Nucleus | |||||
| Expt A |
5 peptides |
10 spectra |
|
0.000 0.000 | 0.000 |
0.000 0.000 | 0.000 |
0.000 0.000 | 0.000 |
0.259 0.200 | 0.313 |
0.168 0.120 | 0.204 |
0.221 0.166 | 0.267 |
0.154 0.126 | 0.178 |
0.197 0.180 | 0.212 |
| 3 spectra, IQEVQEK | 0.000 | 0.000 | 0.000 | 0.349 | 0.048 | 0.144 | 0.276 | 0.183 | ||
| 2 spectra, QQLQFNLQNTR | 0.000 | 0.000 | 0.000 | 0.099 | 0.338 | 0.335 | 0.000 | 0.227 | ||
| 2 spectra, RPLGFTWTK | 0.038 | 0.000 | 0.000 | 0.061 | 0.226 | 0.381 | 0.124 | 0.169 | ||
| 1 spectrum, AICLSTGSR | 0.000 | 0.000 | 0.000 | 0.080 | 0.451 | 0.117 | 0.183 | 0.170 | ||
| 2 spectra, LQCHEIELER | 0.013 | 0.000 | 0.038 | 0.504 | 0.000 | 0.091 | 0.169 | 0.185 |
| Plot | Mito | Lyso or Perox | ER | Golgi | PM | Cytosol | Nucleus | ||||||
| Expt B |
1 peptide |
1 spectrum |
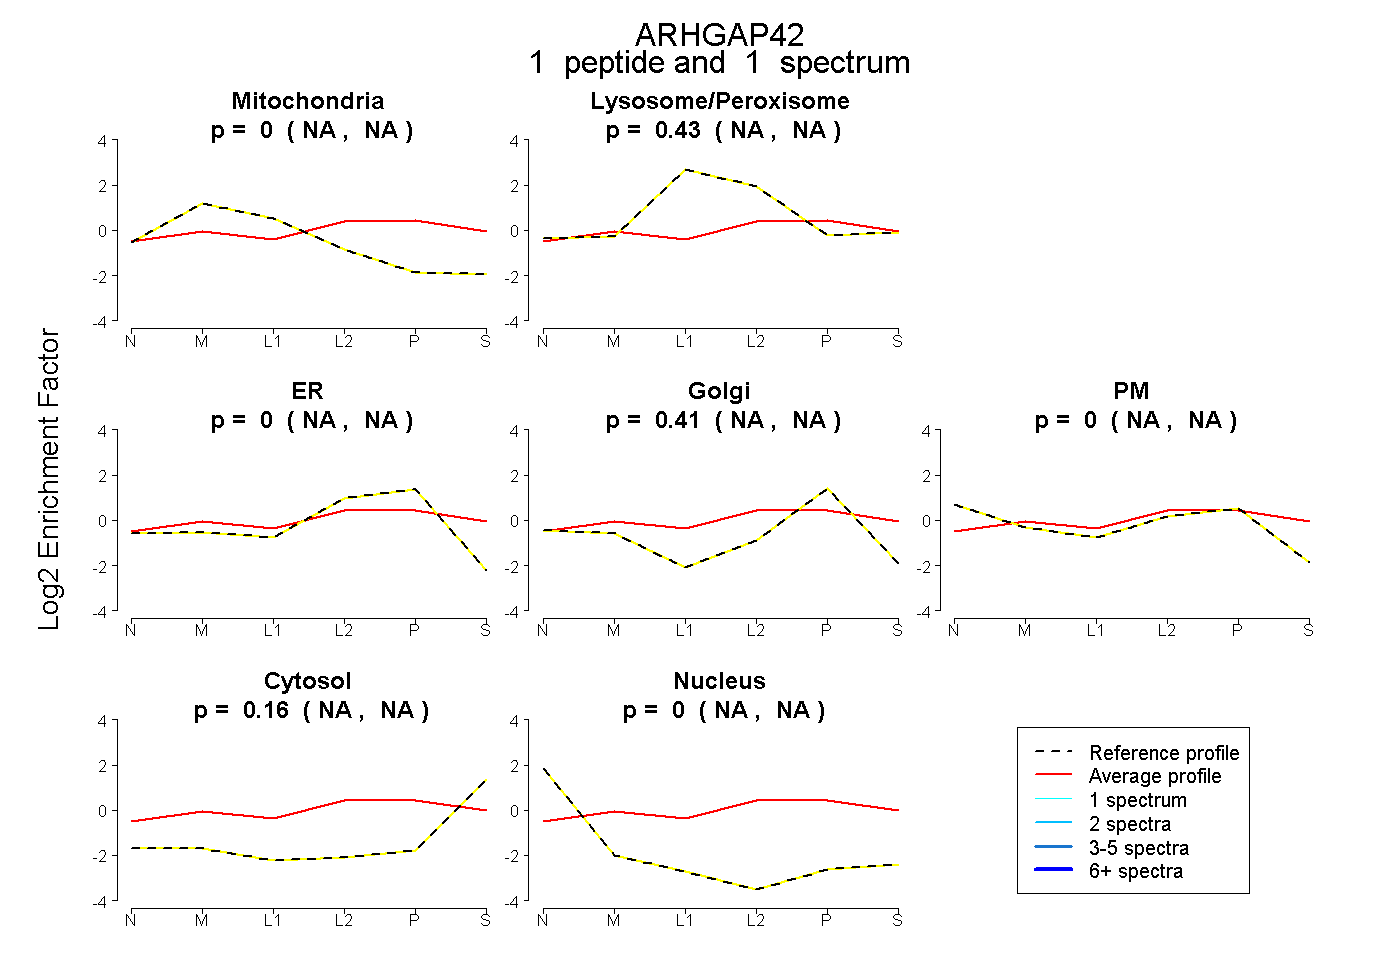 |
0.000 NA | NA |
0.430 NA | NA |
0.000 NA | NA |
0.408 NA | NA |
0.000 NA | NA |
0.162 NA | NA |
0.000 NA | NA |
|||
| Plot | Lyso | Other | |||||||||||
| Expt C |
2 peptides |
4 spectra |
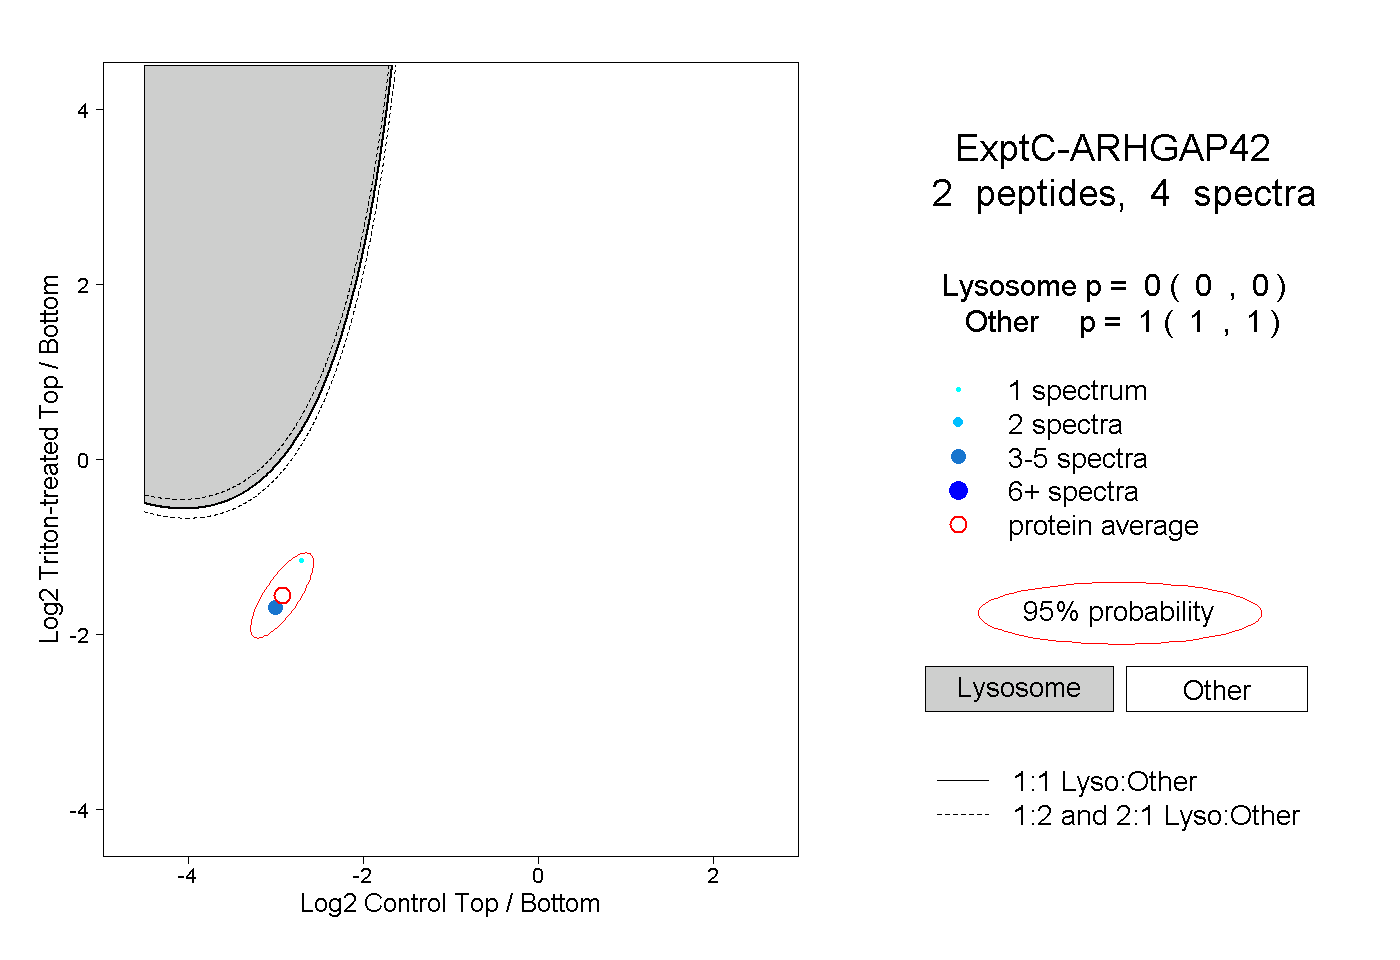 |
0.000 0.000 | 0.000 |
1.000 1.000 | 1.000 |
||||||||
| Plot | Lyso | Other | |||||||||||
| Expt D |
2 peptides |
2 spectra |
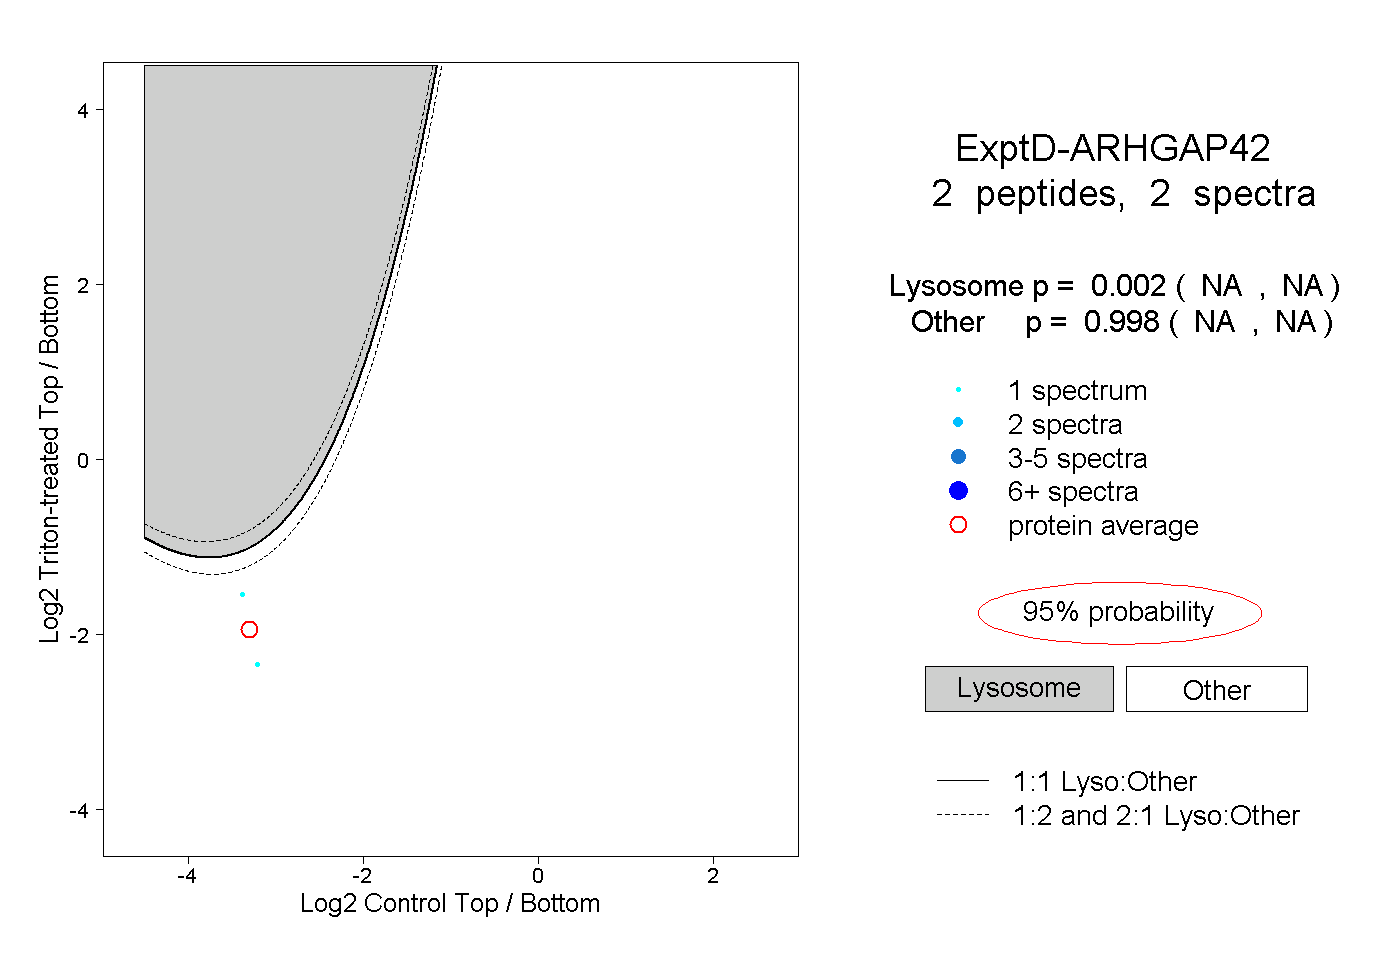 |
0.002 NA | NA |
0.998 NA | NA |