 1
1peptide
spectra
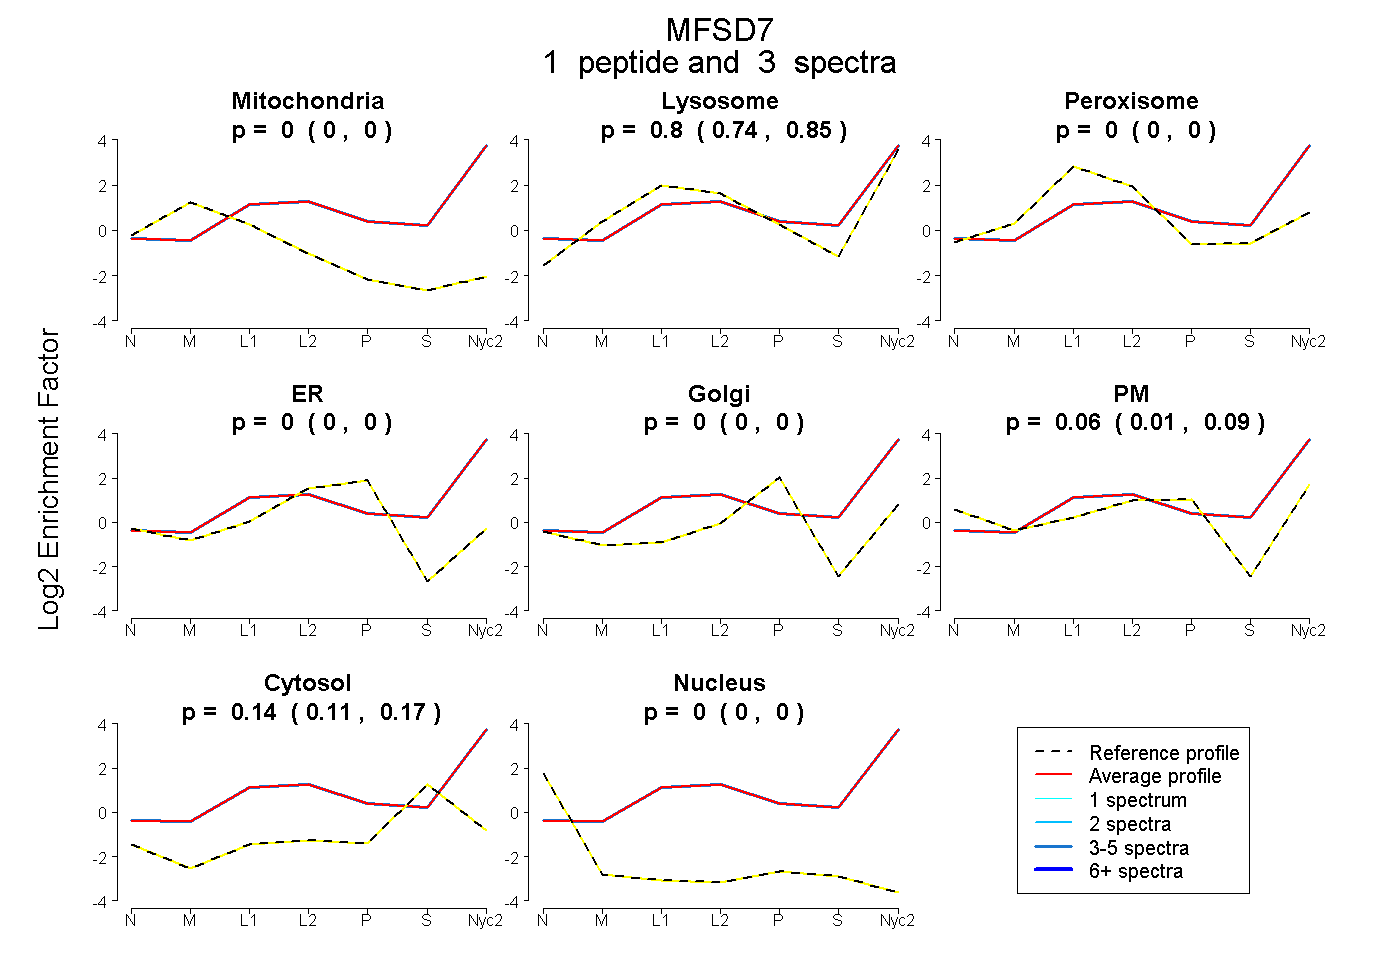
0.000 | 0.000
0.745 | 0.851
0.000 | 0.000
0.000 | 0.000
0.000 | 0.000
0.007 | 0.093
0.112 | 0.168
0.000 | 0.000
1peptide
spectrum
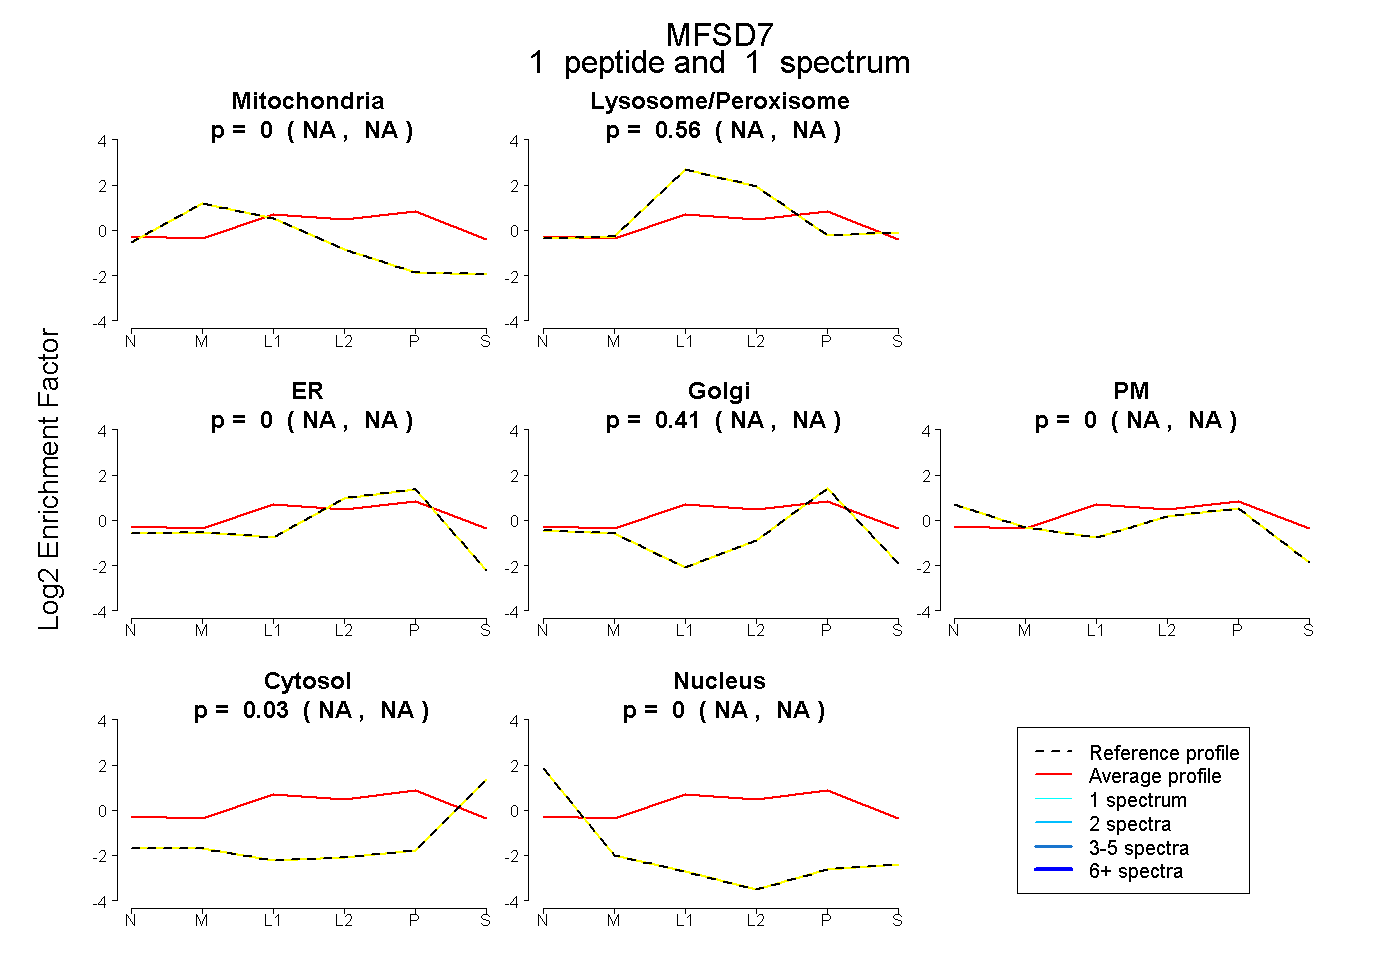
NA | NA
NA | NA
NA | NA
NA | NA
NA | NA
NA | NA
NA | NA
3peptides
spectra
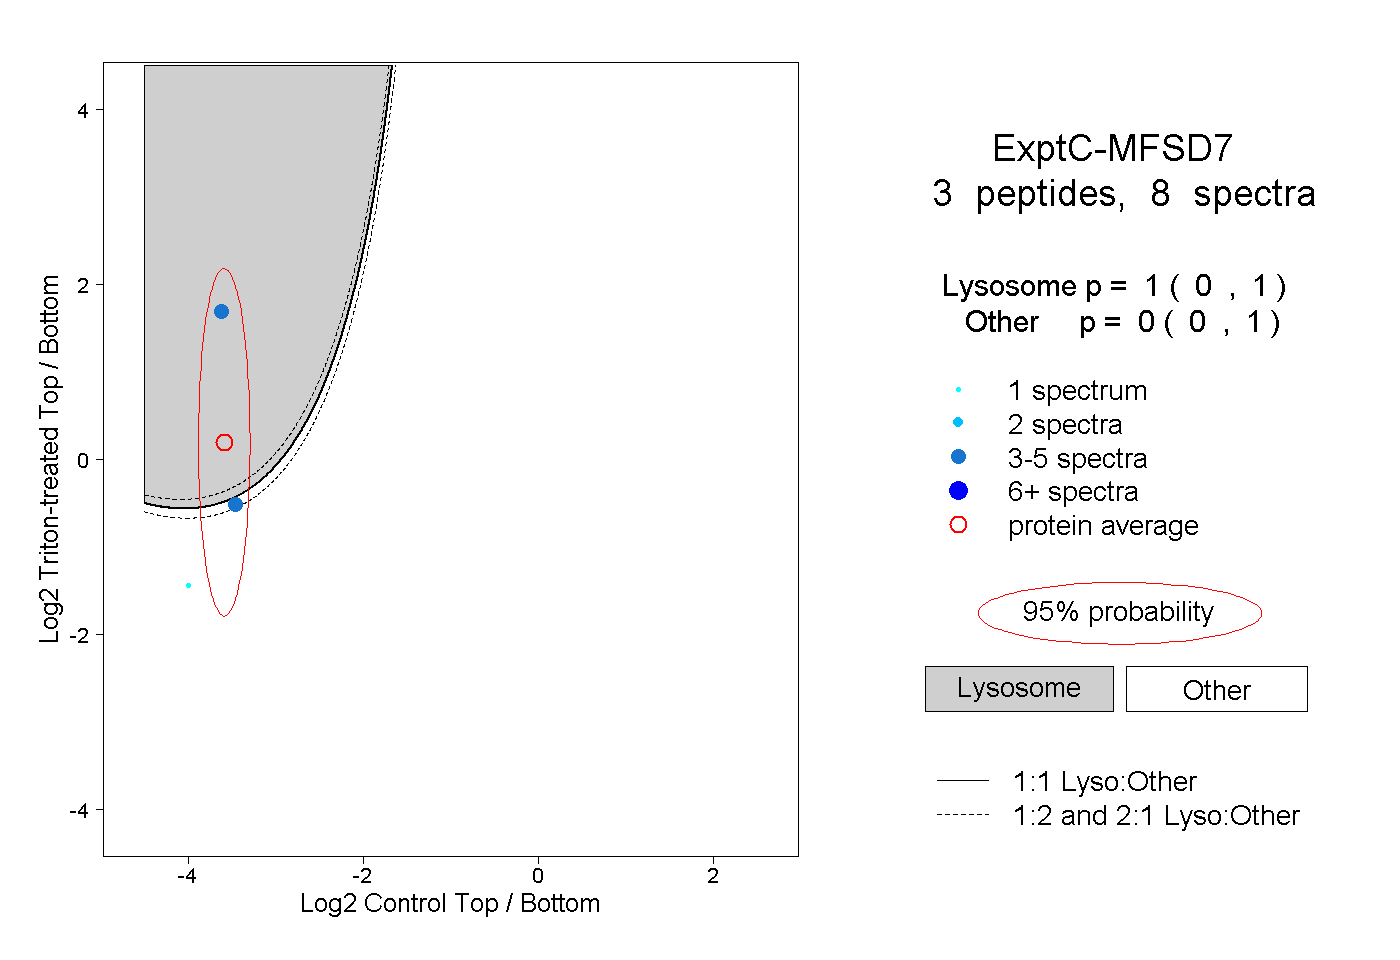
0.000 | 1.000
0.000 | 1.000