 2
2peptides
spectra
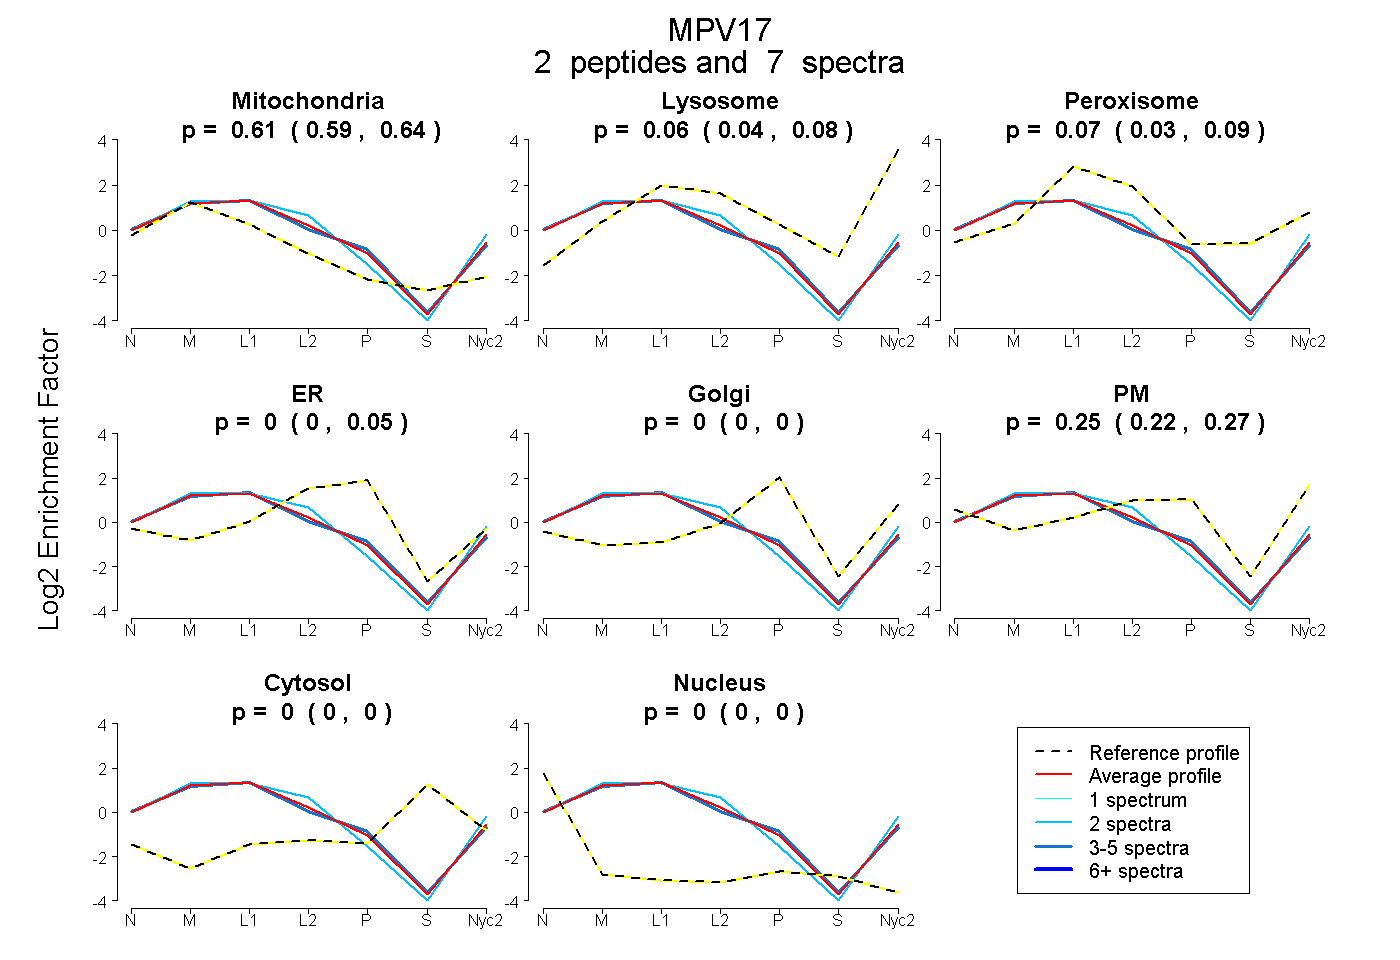
0.587 | 0.636
0.037 | 0.084
0.030 | 0.093
0.000 | 0.047
0.000 | 0.000
0.216 | 0.267
0.000 | 0.000
0.000 | 0.000
2peptides
spectra
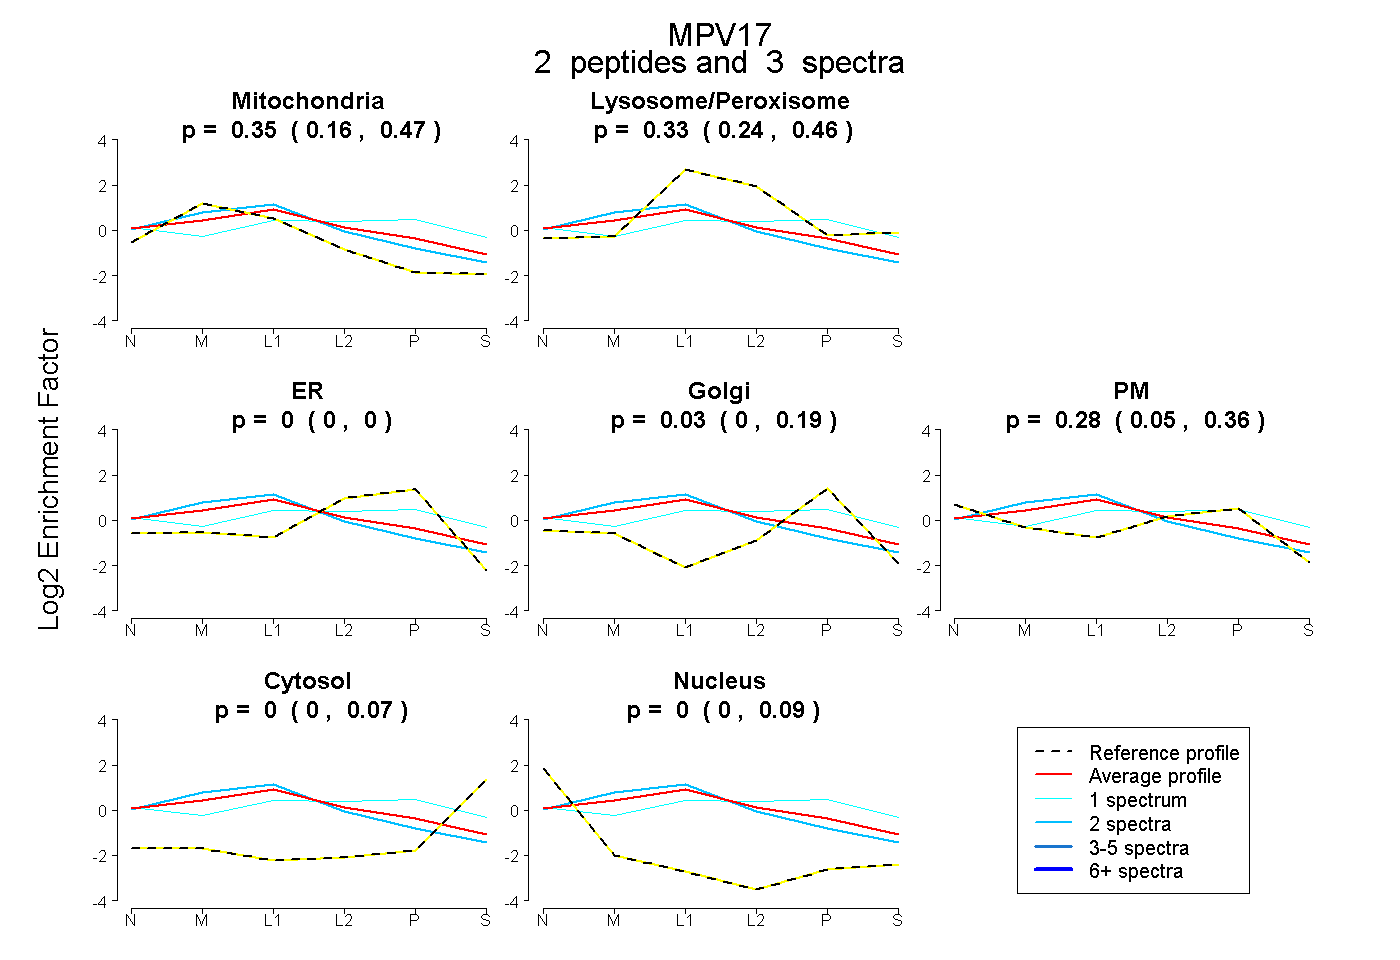
0.162 | 0.472
0.241 | 0.463
0.000 | 0.000
0.000 | 0.186
0.045 | 0.362
0.000 | 0.067
0.000 | 0.085
3peptides
spectra
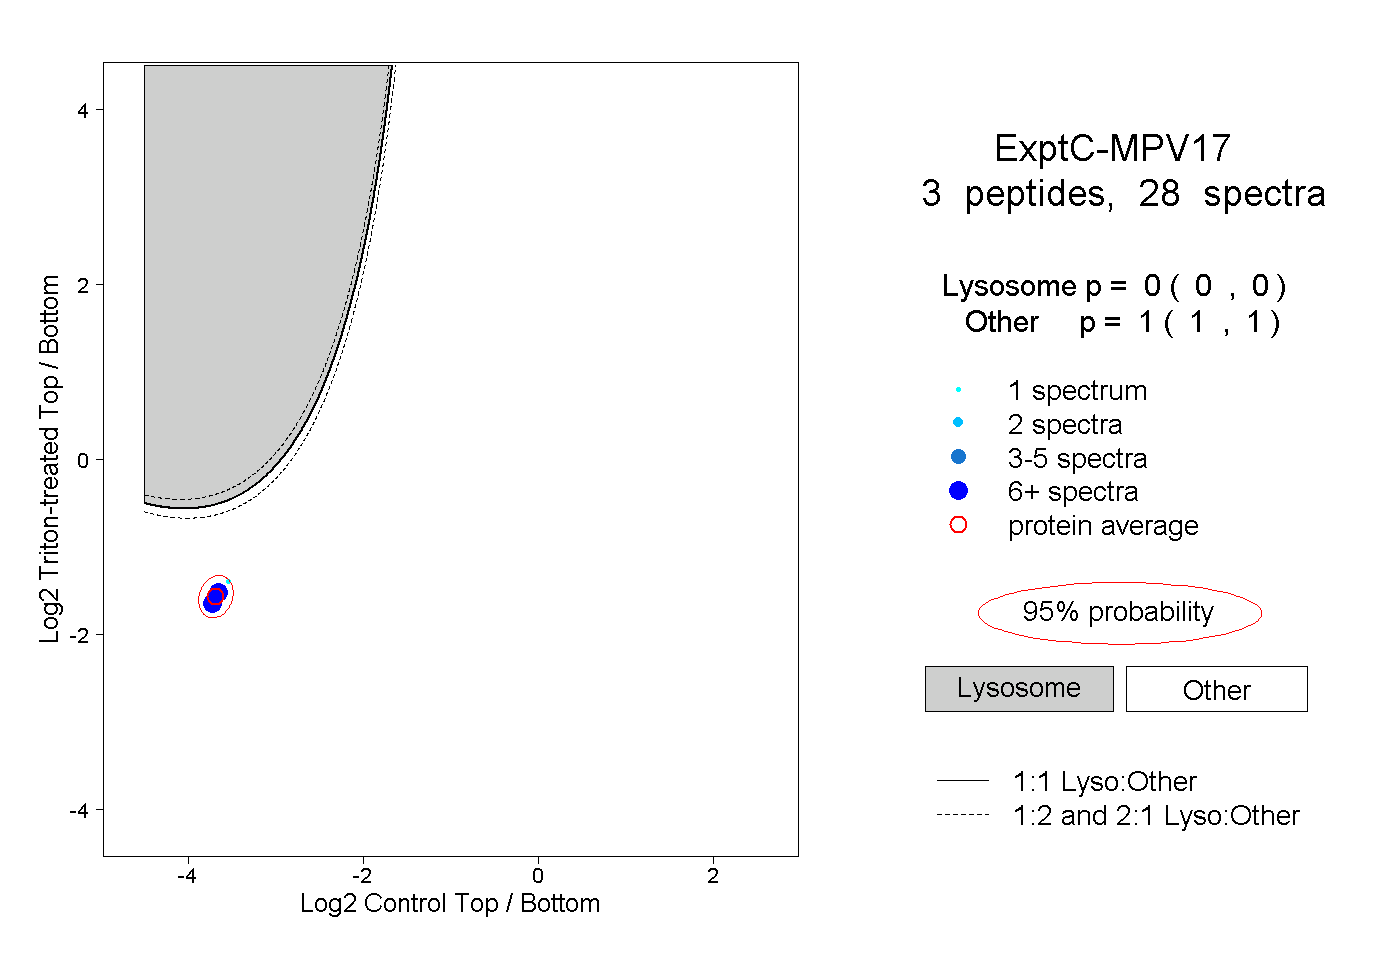
0.000 | 0.000
1.000 | 1.000
1peptide
spectrum
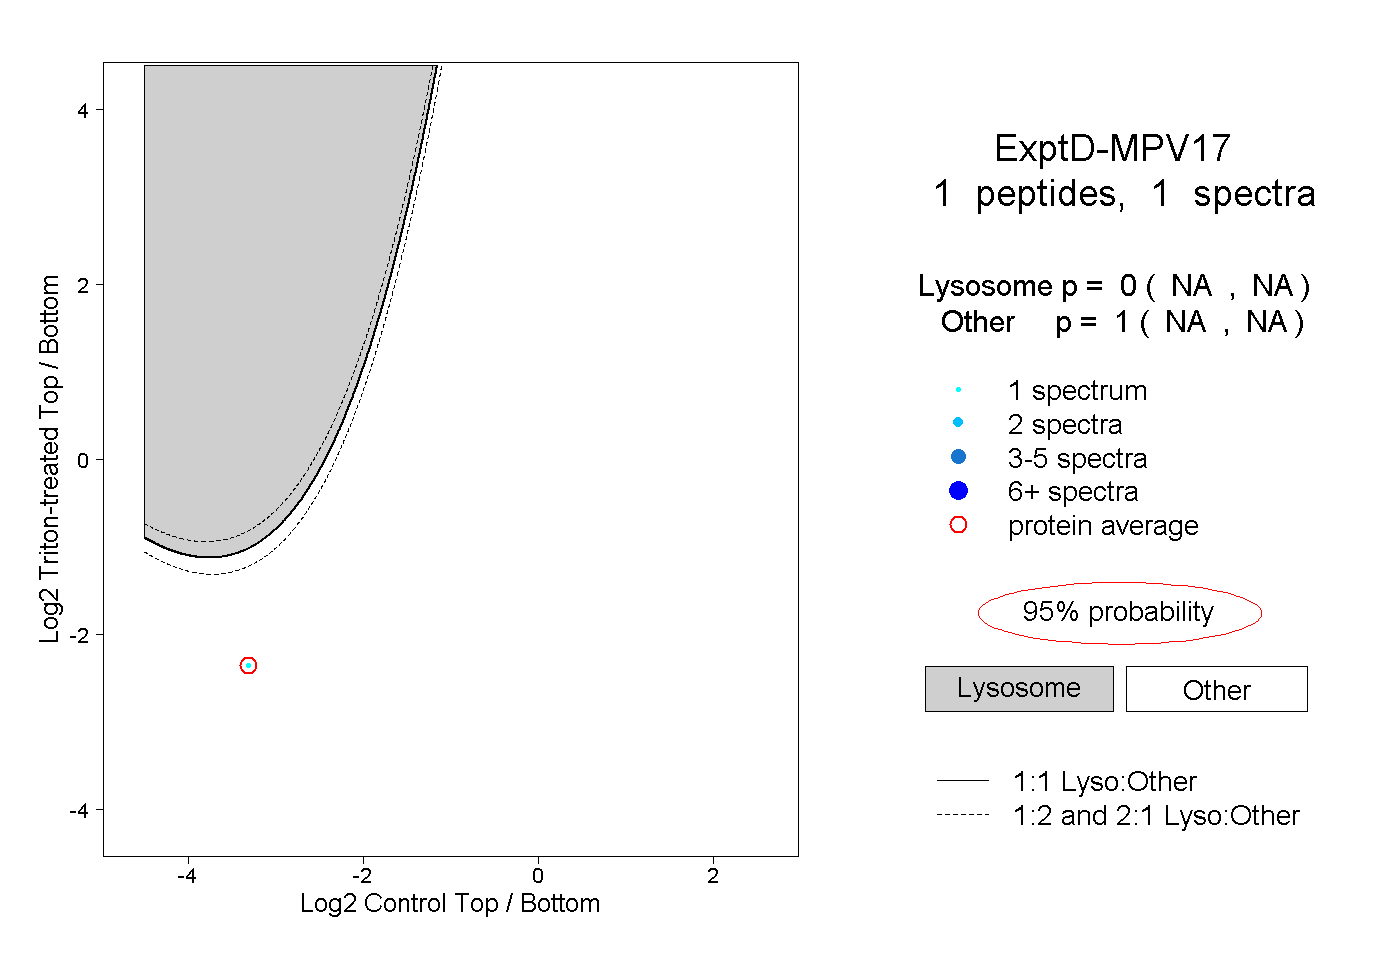
NA | NA
NA | NA