 2
2peptides
spectra
0.587 | 0.636
0.037 | 0.084
0.030 | 0.093
0.000 | 0.047
0.000 | 0.000
0.216 | 0.267
0.000 | 0.000
0.000 | 0.000
| Plot | Mito | Lyso | Perox | ER | Golgi | PM | Cytosol | Nucleus | |||||
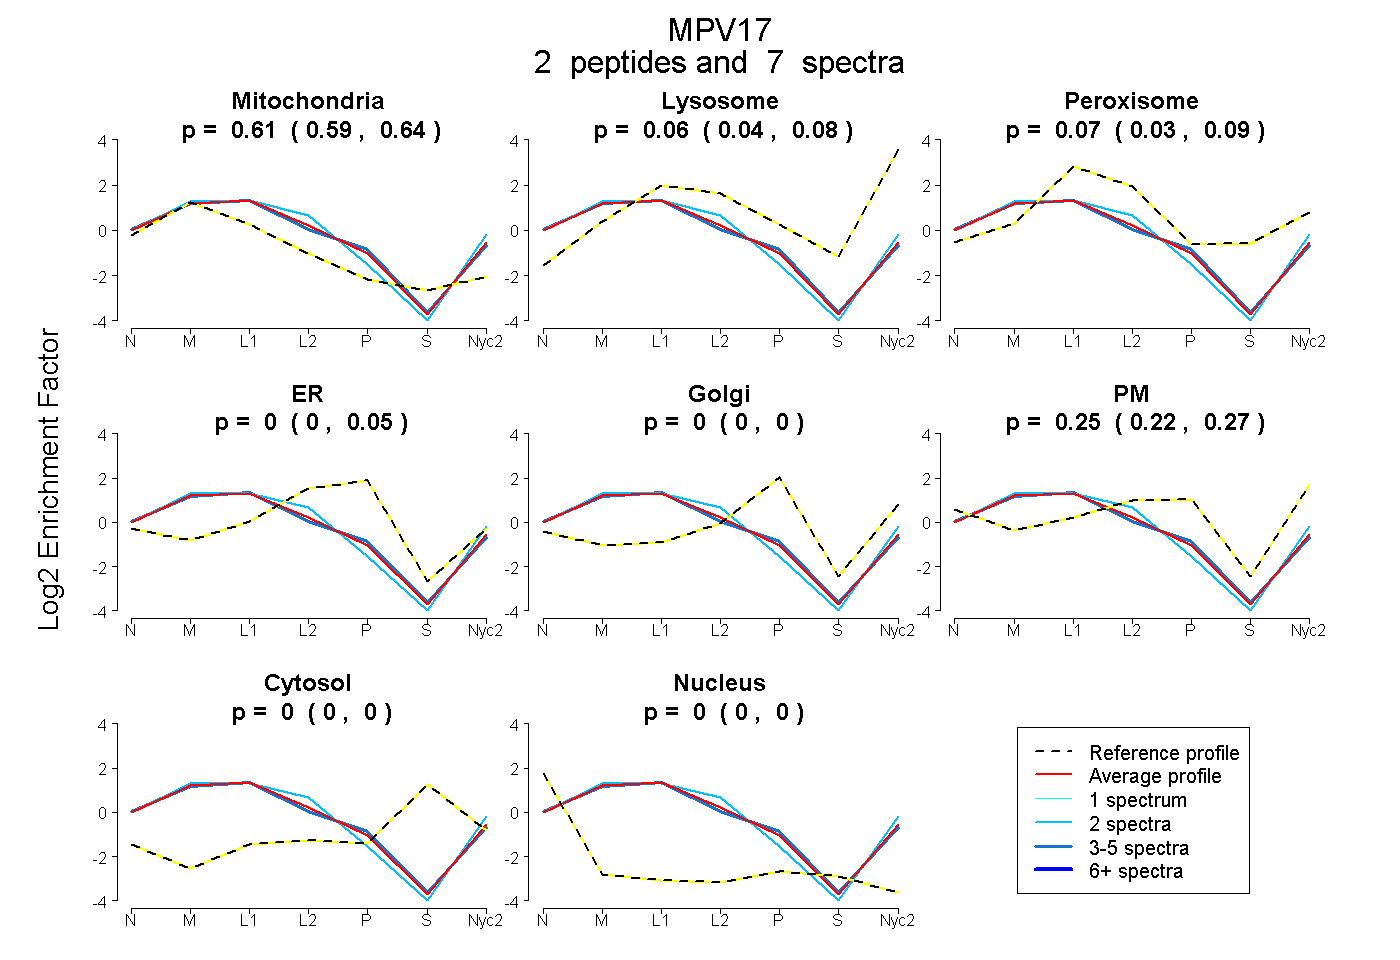
| Expt A |
2 peptides |
7 spectra |
|
0.615 0.587 | 0.636 |
0.057 0.037 | 0.084 |
0.068 0.030 | 0.093 |
0.005 0.000 | 0.047 |
0.000 0.000 | 0.000 |
0.255 0.216 | 0.267 |
0.000 0.000 | 0.000 |
0.000 0.000 | 0.000 |
| 2 spectra, VLDHLIPGTTK | 0.619 | 0.159 | 0.032 | 0.000 | 0.000 | 0.190 | 0.000 | 0.000 | ||
| 5 spectra, ALAAHPWK | 0.614 | 0.036 | 0.068 | 0.049 | 0.000 | 0.233 | 0.000 | 0.000 |
| Plot | Mito | Lyso or Perox | ER | Golgi | PM | Cytosol | Nucleus | ||||||
| Expt B |
2 peptides |
3 spectra |
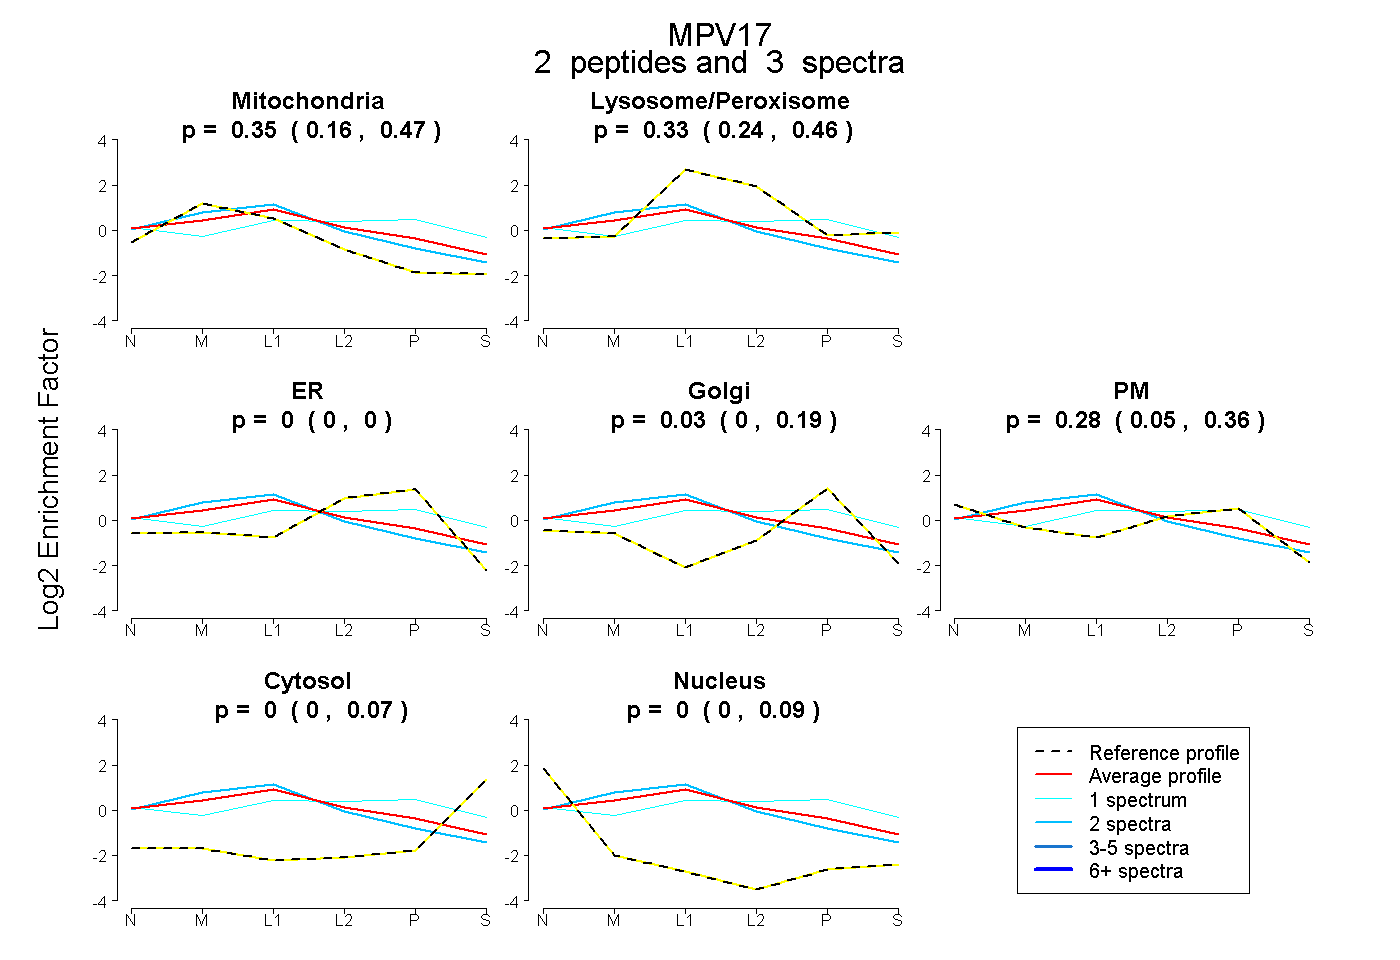 |
0.354 0.162 | 0.472 |
0.334 0.241 | 0.463 |
0.000 0.000 | 0.000 |
0.028 0.000 | 0.186 |
0.280 0.045 | 0.362 |
0.004 0.000 | 0.067 |
0.000 0.000 | 0.085 |
|||
| Plot | Lyso | Other | |||||||||||
| Expt C |
3 peptides |
28 spectra |
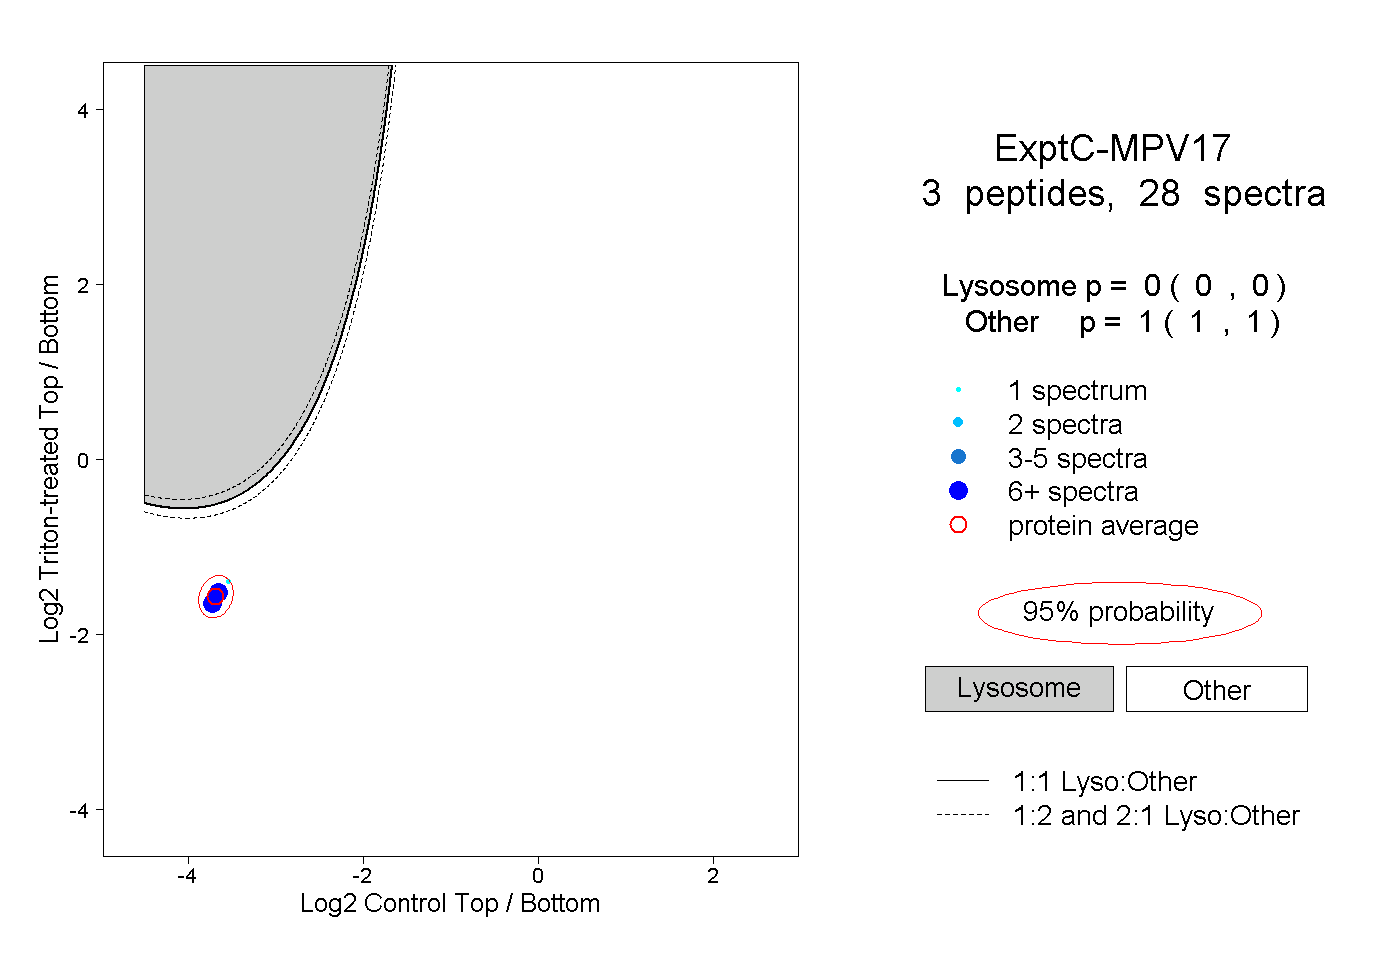 |
0.000 0.000 | 0.000 |
1.000 1.000 | 1.000 |
||||||||
| Plot | Lyso | Other | |||||||||||
| Expt D |
1 peptide |
1 spectrum |
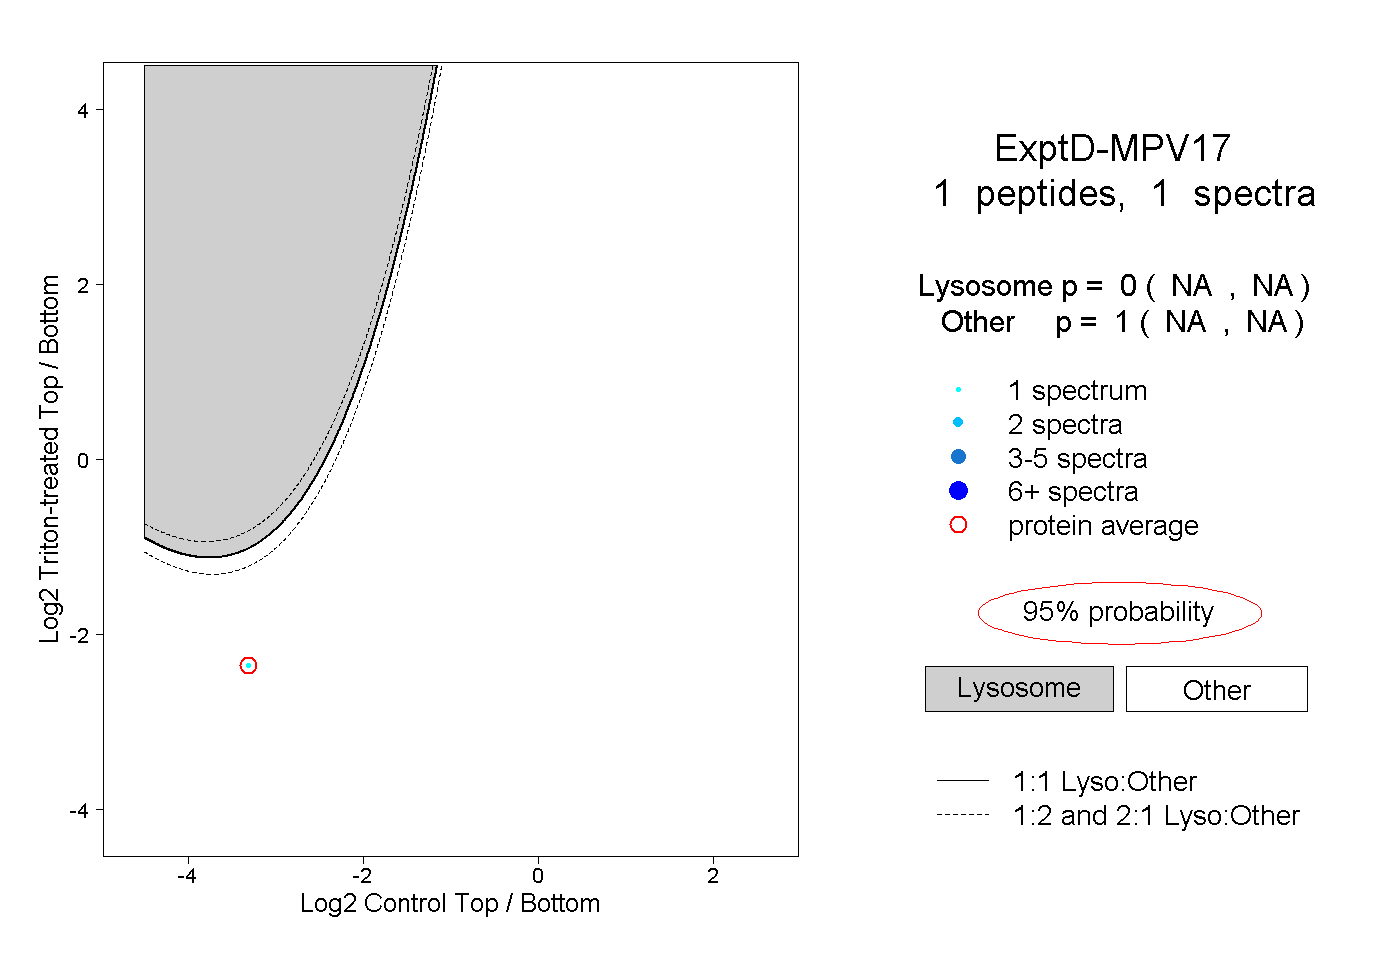 |
0.000 NA | NA |
1.000 NA | NA |