 1
1peptide
spectrum
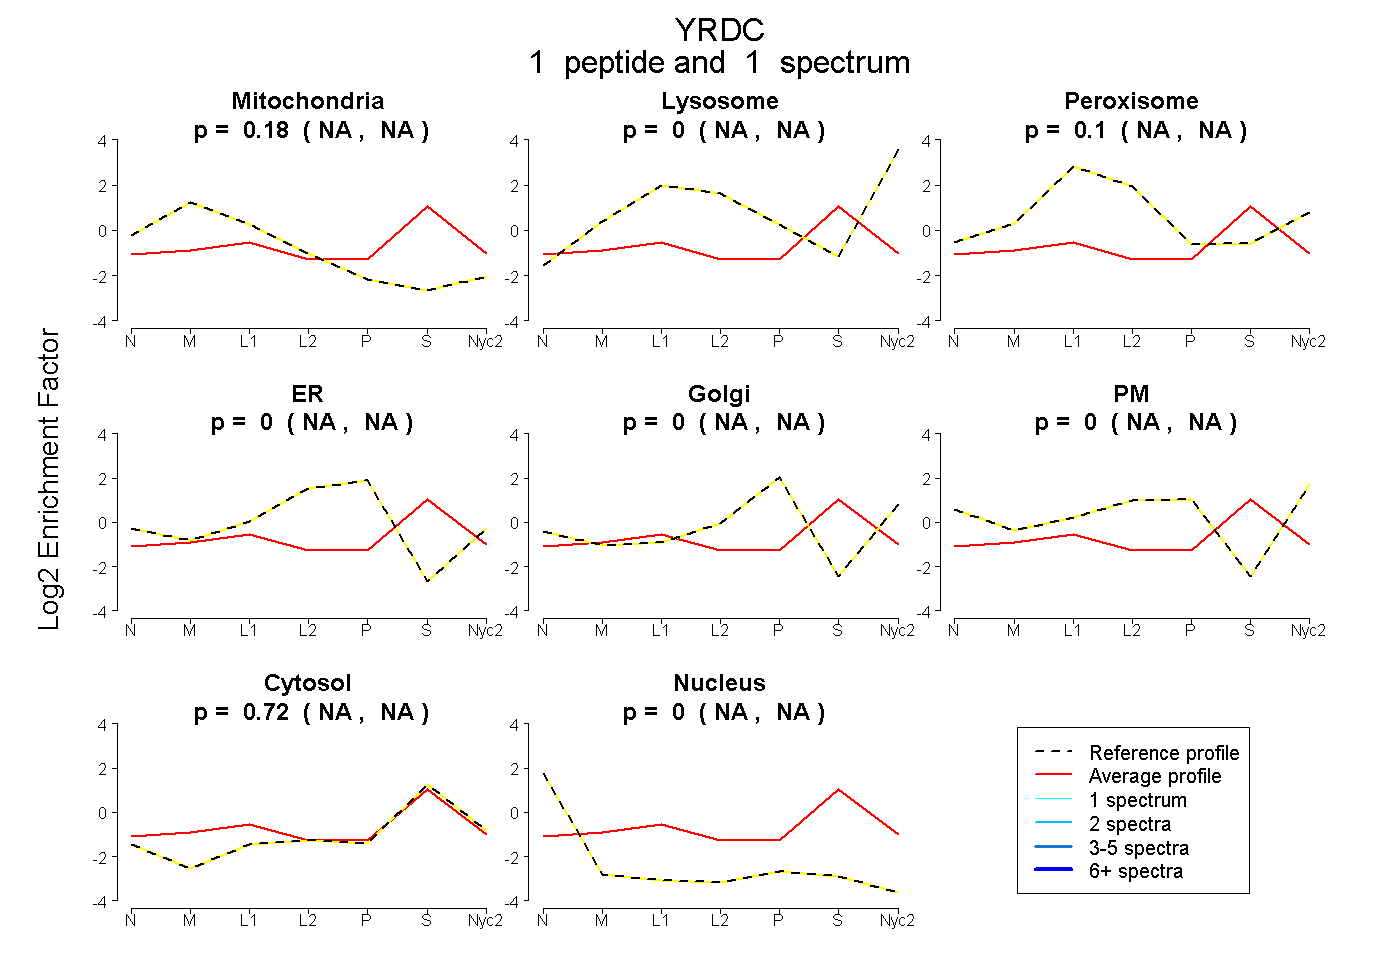
NA | NA
NA | NA
NA | NA
NA | NA
NA | NA
NA | NA
NA | NA
NA | NA
1peptide
spectra
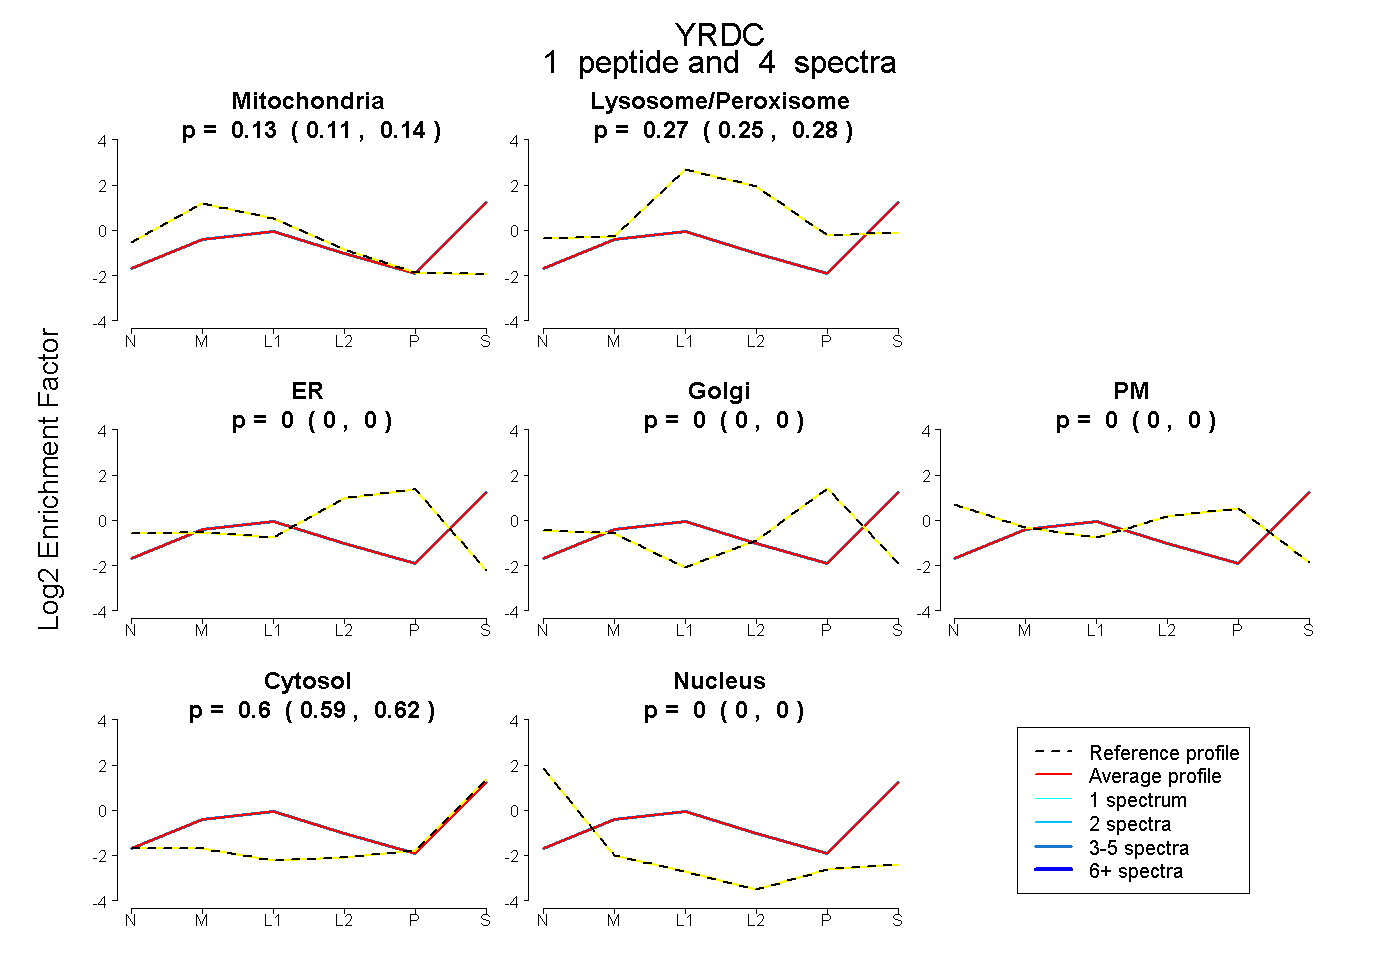
0.108 | 0.145
0.250 | 0.284
0.000 | 0.000
0.000 | 0.000
0.000 | 0.000
0.588 | 0.617
0.000 | 0.000
2peptides
spectra
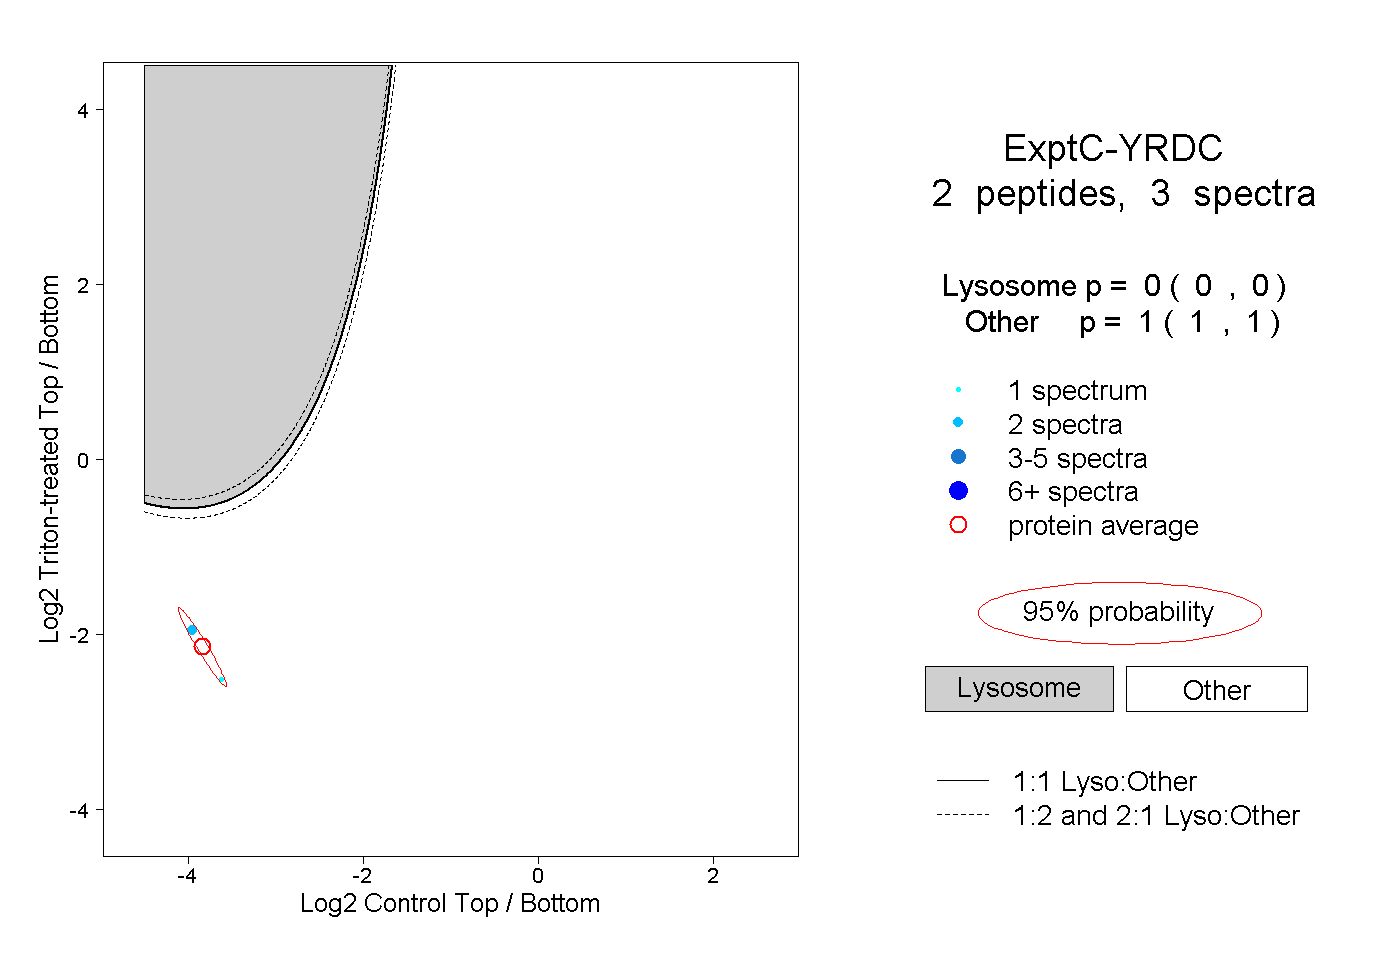
0.000 | 0.000
1.000 | 1.000