18
18peptides
spectra
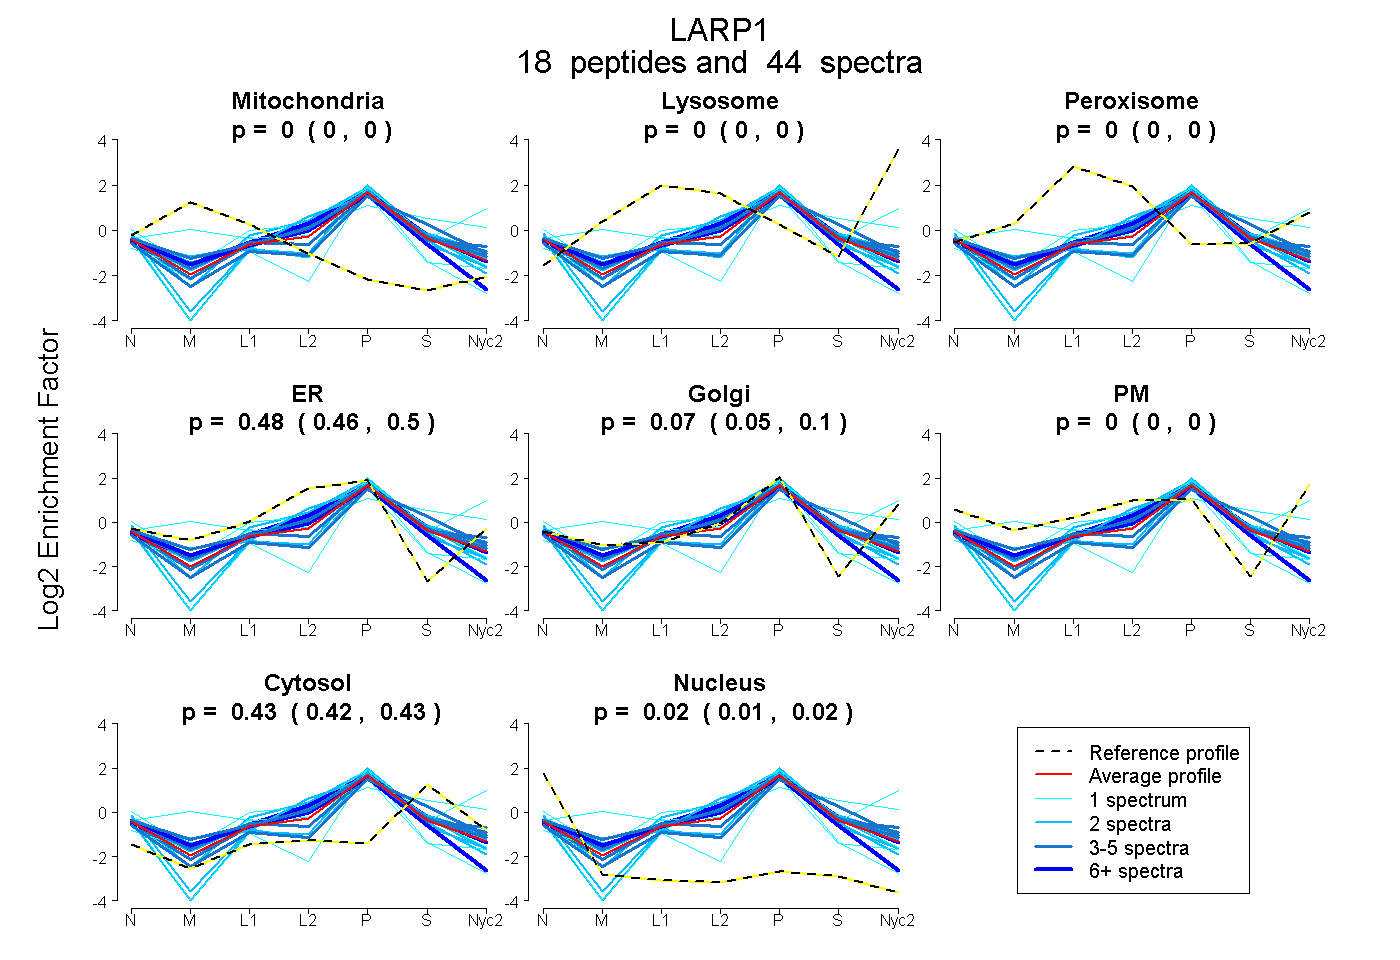
0.000 | 0.000
0.000 | 0.000
0.000 | 0.000
0.458 | 0.499
0.050 | 0.095
0.000 | 0.000
0.421 | 0.432
0.014 | 0.023
7peptides
spectra
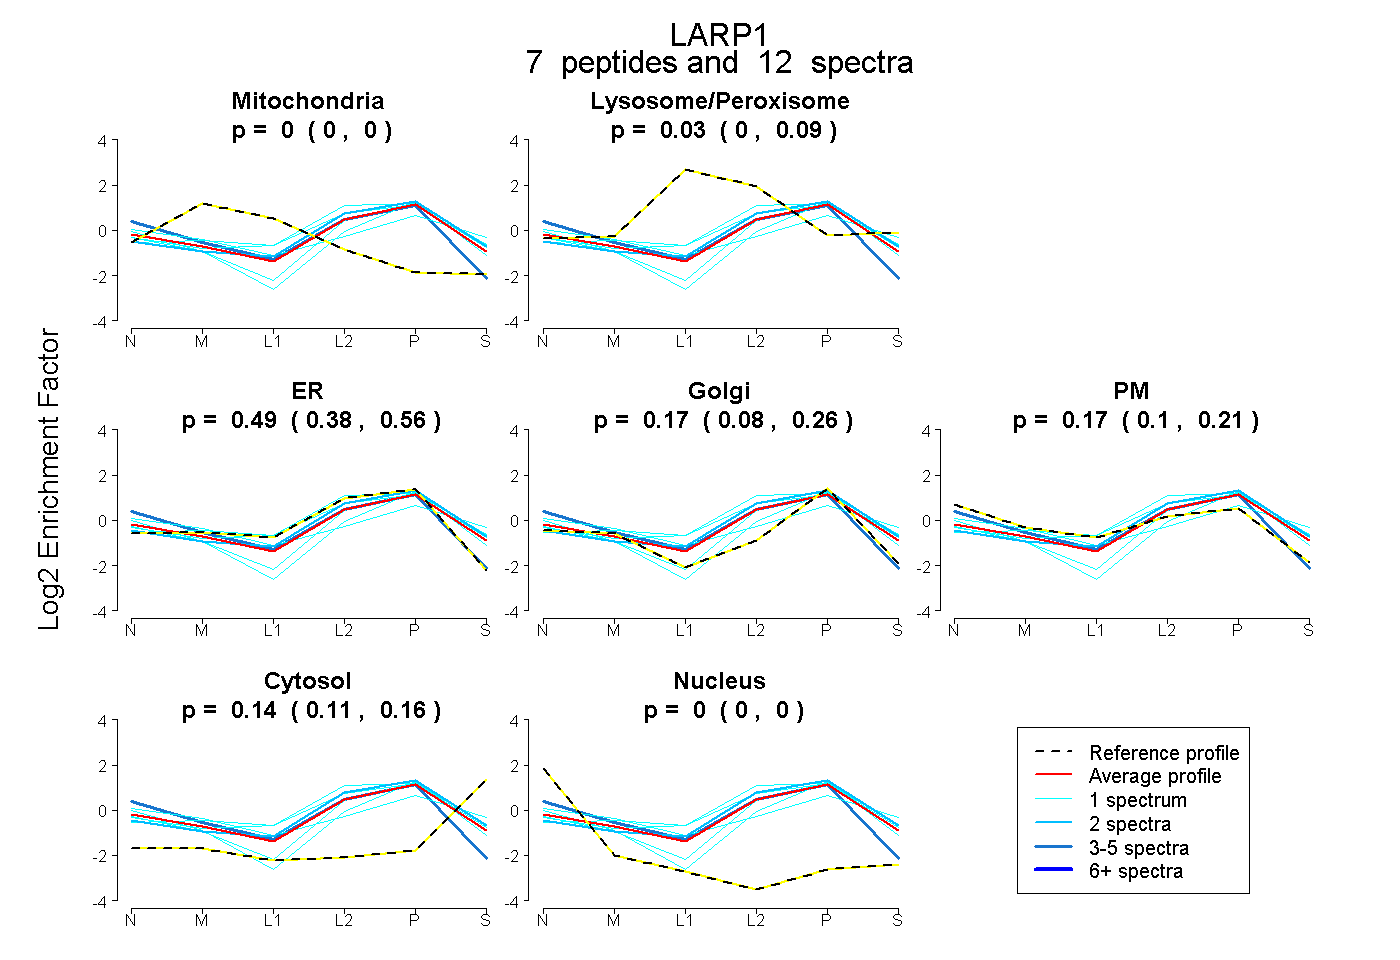
0.000 | 0.000
0.000 | 0.085
0.375 | 0.559
0.083 | 0.263
0.104 | 0.214
0.113 | 0.164
0.000 | 0.000