 3
3peptides
spectra
0.000 | 0.157
0.064 | 0.356
0.000 | 0.280
0.000 | 0.342
0.000 | 0.433
0.008 | 0.363
0.000 | 0.181
0.000 | 0.113
9peptides
spectra
0.000 | 0.000
1.000 | 1.000
| Plot | Mito | Lyso | Perox | ER | Golgi | PM | Cytosol | Nucleus | |||||
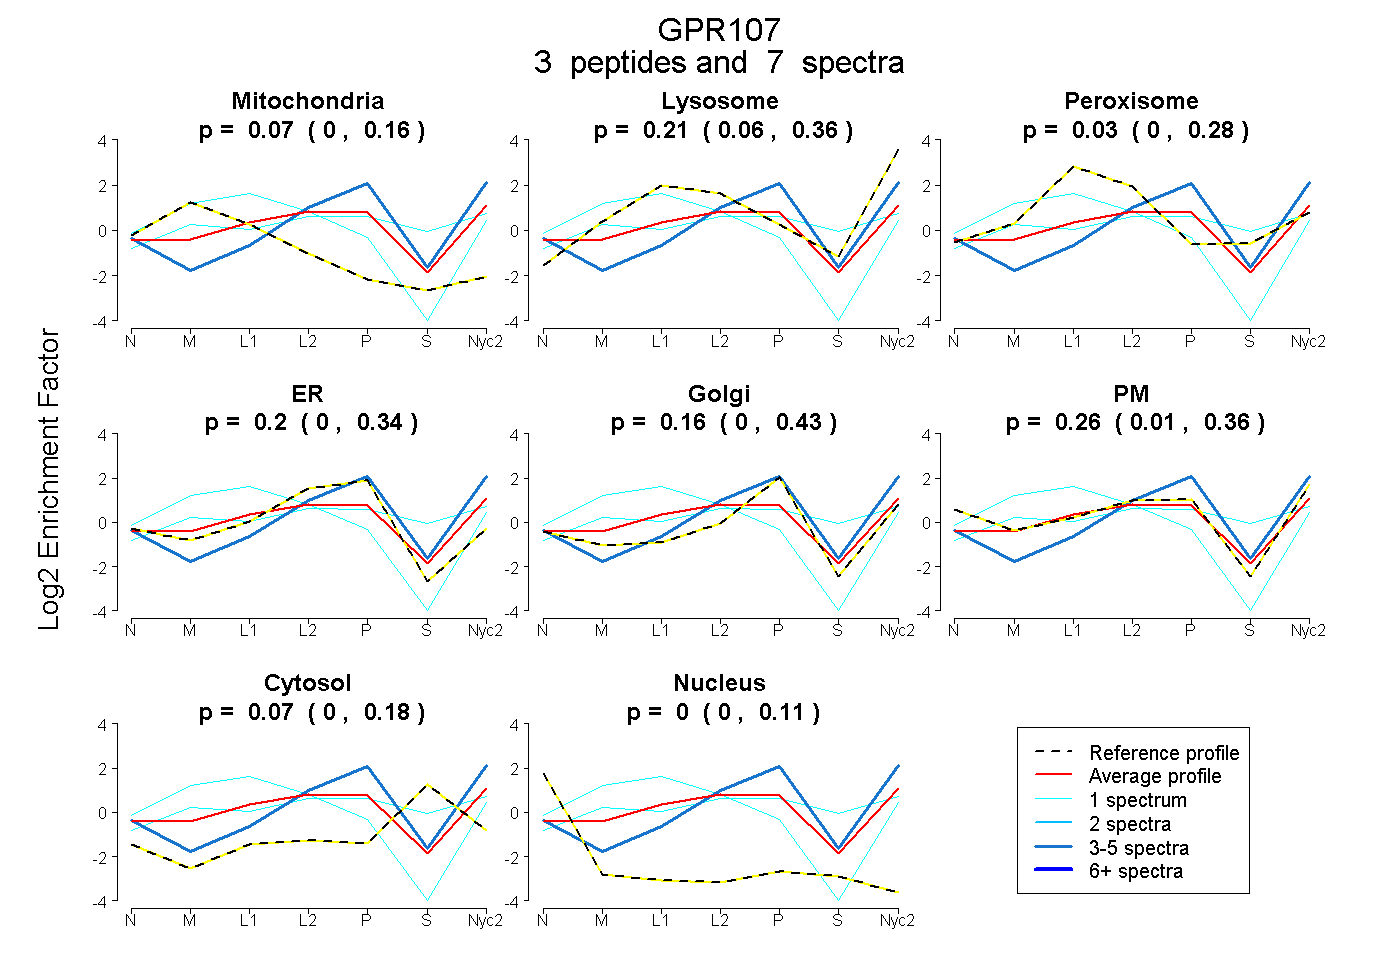
| Expt A |
3 peptides |
7 spectra |
|
0.065 0.000 | 0.157 |
0.211 0.064 | 0.356 |
0.035 0.000 | 0.280 |
0.200 0.000 | 0.342 |
0.158 0.000 | 0.433 |
0.259 0.008 | 0.363 |
0.072 0.000 | 0.181 |
0.000 0.000 | 0.113 |
||
| Plot | Lyso | Other | |||||||||||
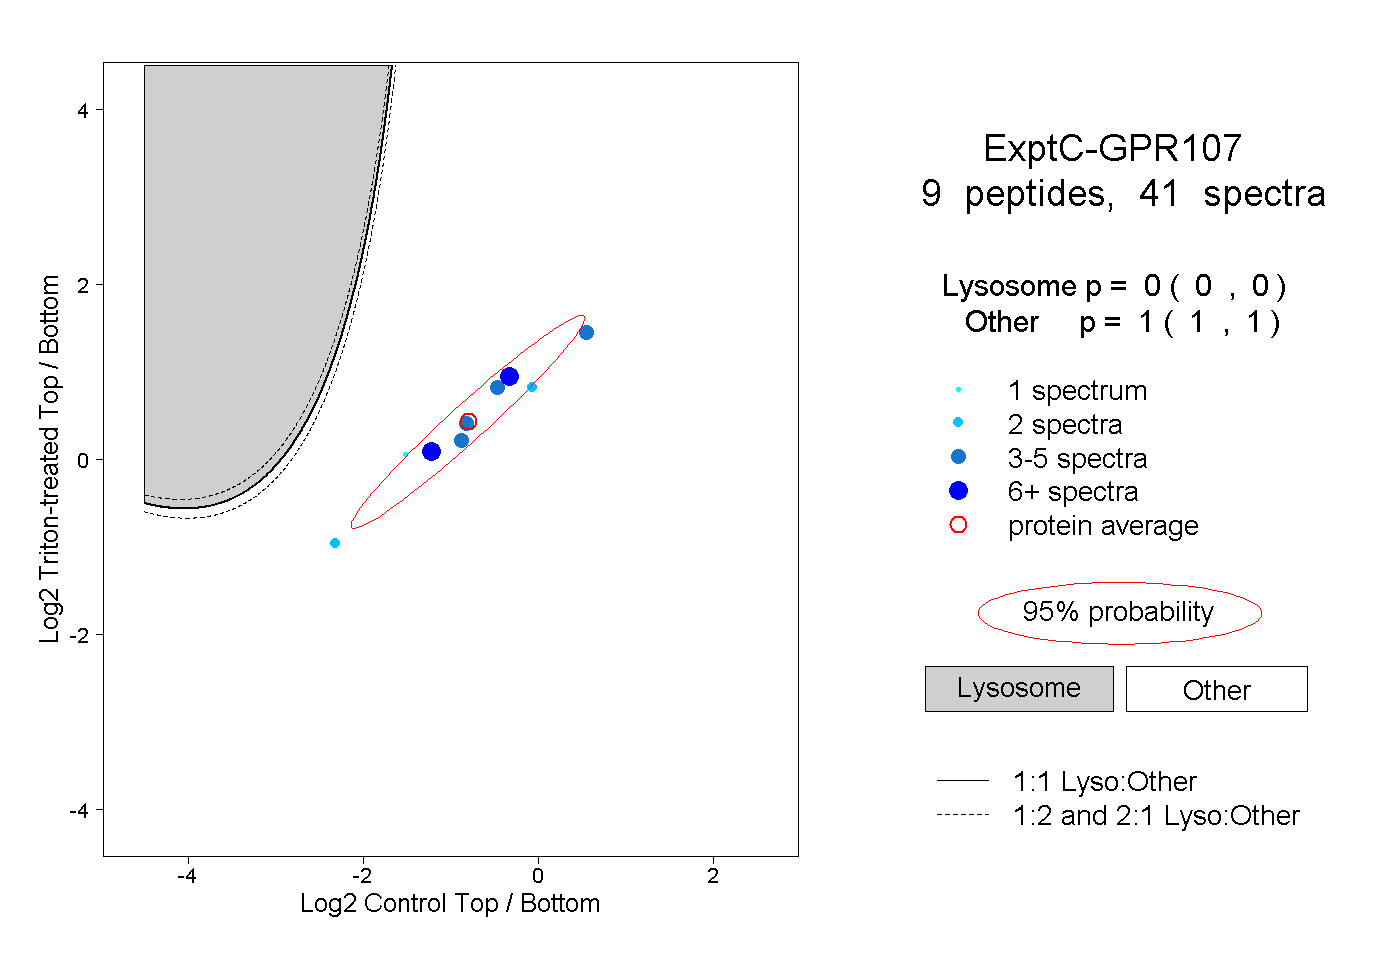
| Expt C |
9 peptides |
41 spectra |
|
0.000 0.000 | 0.000 |
1.000 1.000 | 1.000 |
| 4 spectra, STVDSK | 0.000 | 1.000 | ||||||||
| 1 spectrum, FAVPFQWK | 0.000 | 1.000 | ||||||||
| 4 spectra, HLQEASATDGK | 0.000 | 1.000 | ||||||||
| 6 spectra, TPDGSK | 0.000 | 1.000 | ||||||||
| 2 spectra, VHLNTFGFFK | 0.000 | 1.000 | ||||||||
| 3 spectra, AAINLAK | 0.000 | 1.000 | ||||||||
| 2 spectra, QLPEIVFSK | 0.000 | 1.000 | ||||||||
| 16 spectra, SPPEAGK | 0.000 | 1.000 | ||||||||
| 3 spectra, SQEPAVSSNPK | 0.000 | 1.000 |
| Plot | Lyso | Other | |||||||||||
| Expt D |
1 peptide |
1 spectrum |
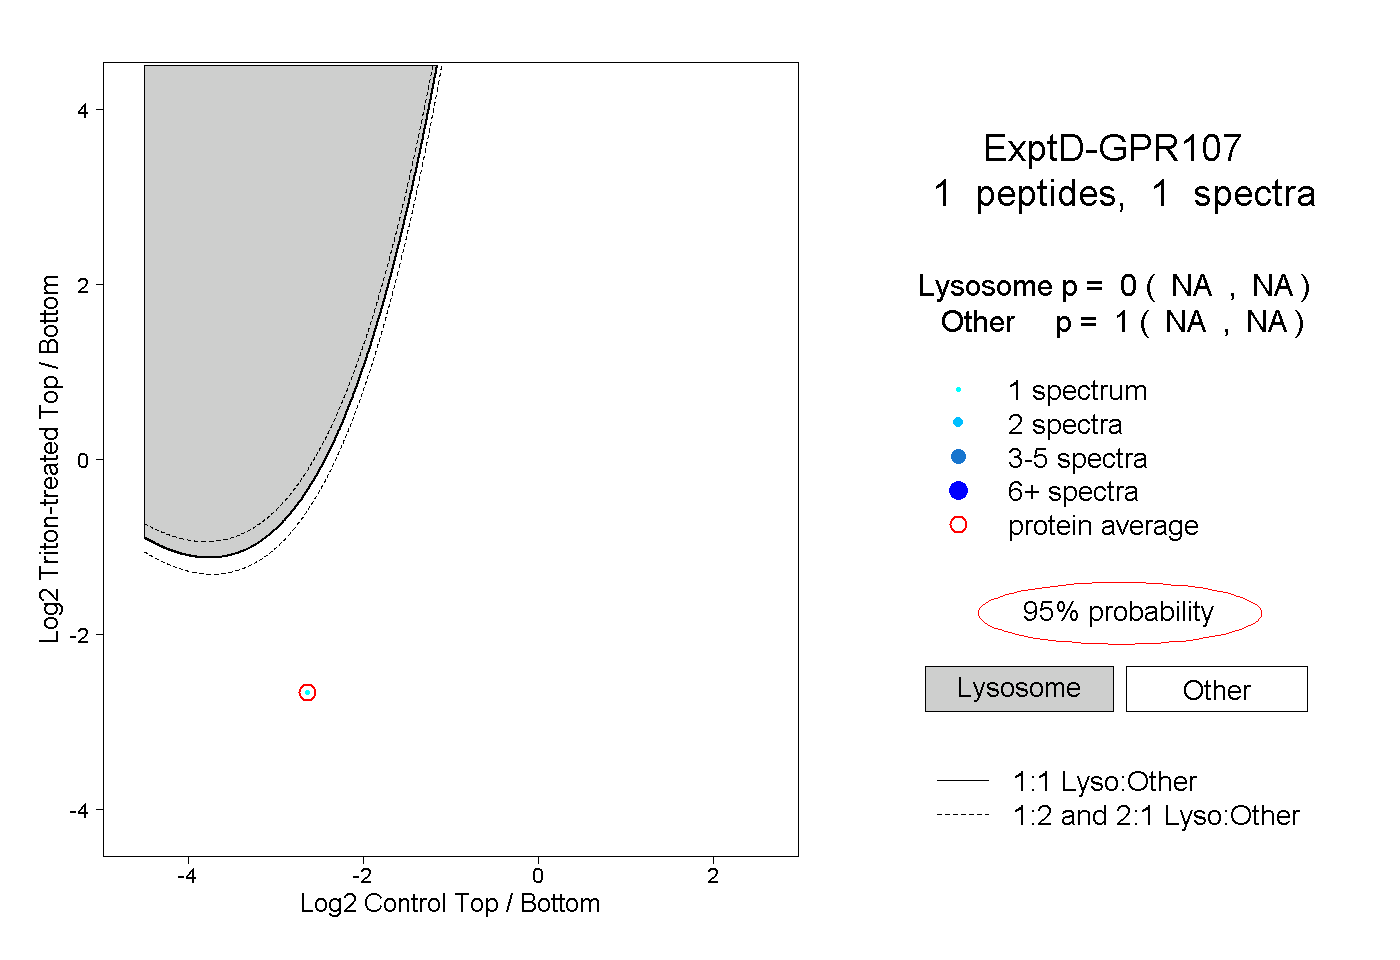 |
0.000 NA | NA |
1.000 NA | NA |