AARS2
[ENSRNOP00000037568]
Main page
| | | Plot |
Mito |
Lyso |
|
Perox |
ER |
Golgi |
PM |
Cytosol |
Nucleus |
|
| Expt A |
 15
15
peptides |
38
spectra |
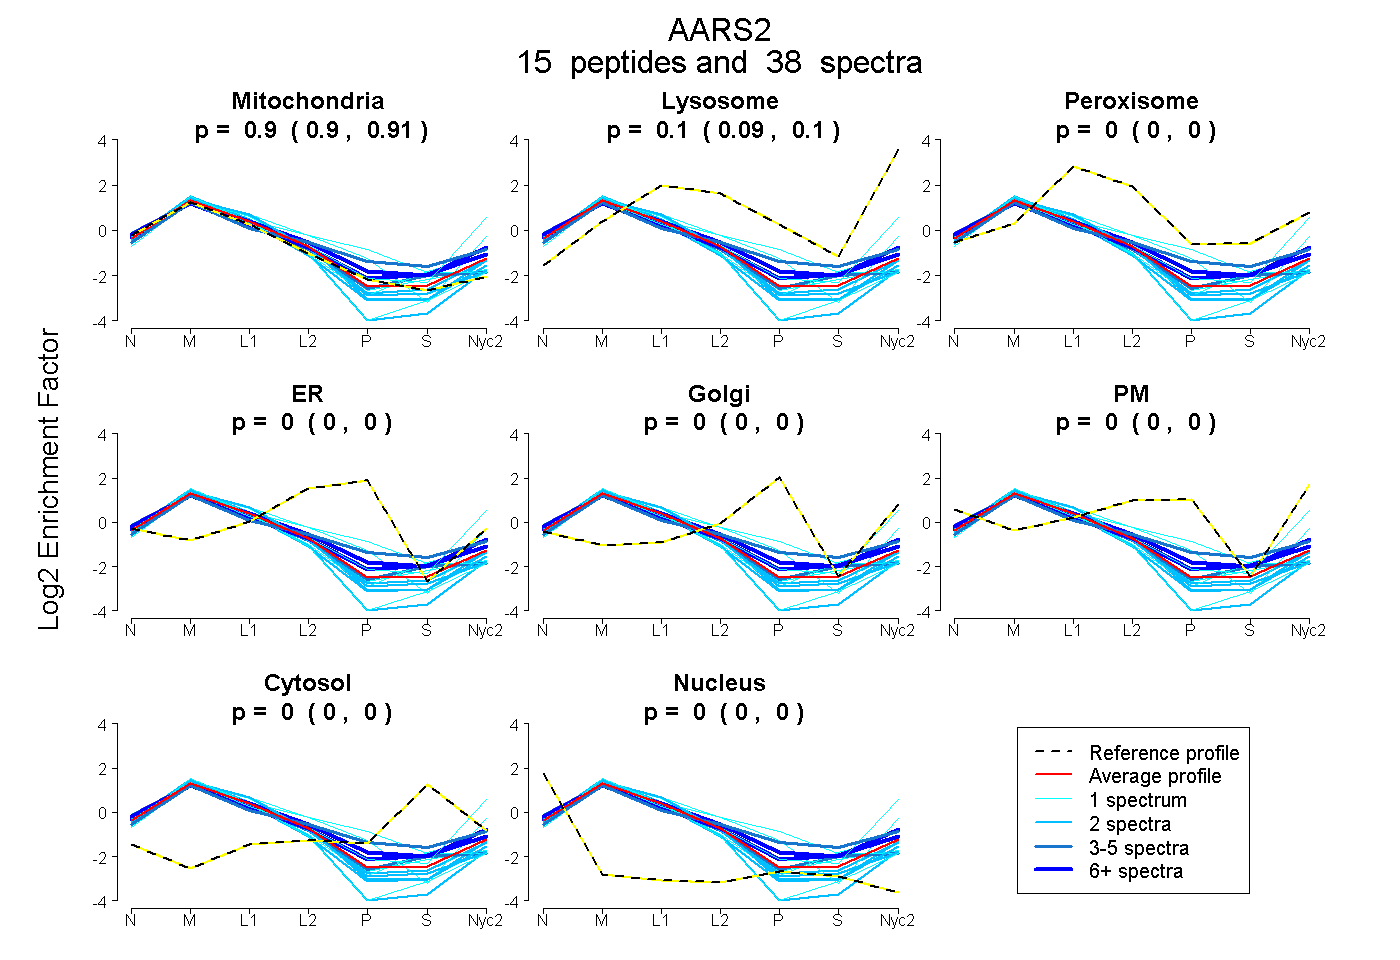 |
0.902
0.896 | 0.908 |
0.098
0.091 | 0.103 |
|
0.000
0.000 | 0.000 |
0.000
0.000 | 0.000 |
0.000
0.000 | 0.000 |
0.000
0.000 | 0.000 |
0.000
0.000 | 0.000 |
0.000
0.000 | 0.000 |
|
| | | Plot |
Mito |
|
Lyso or Perox |
|
ER |
Golgi |
PM |
Cytosol |
Nucleus |
|
| Expt B |
5
peptides |
10
spectra |
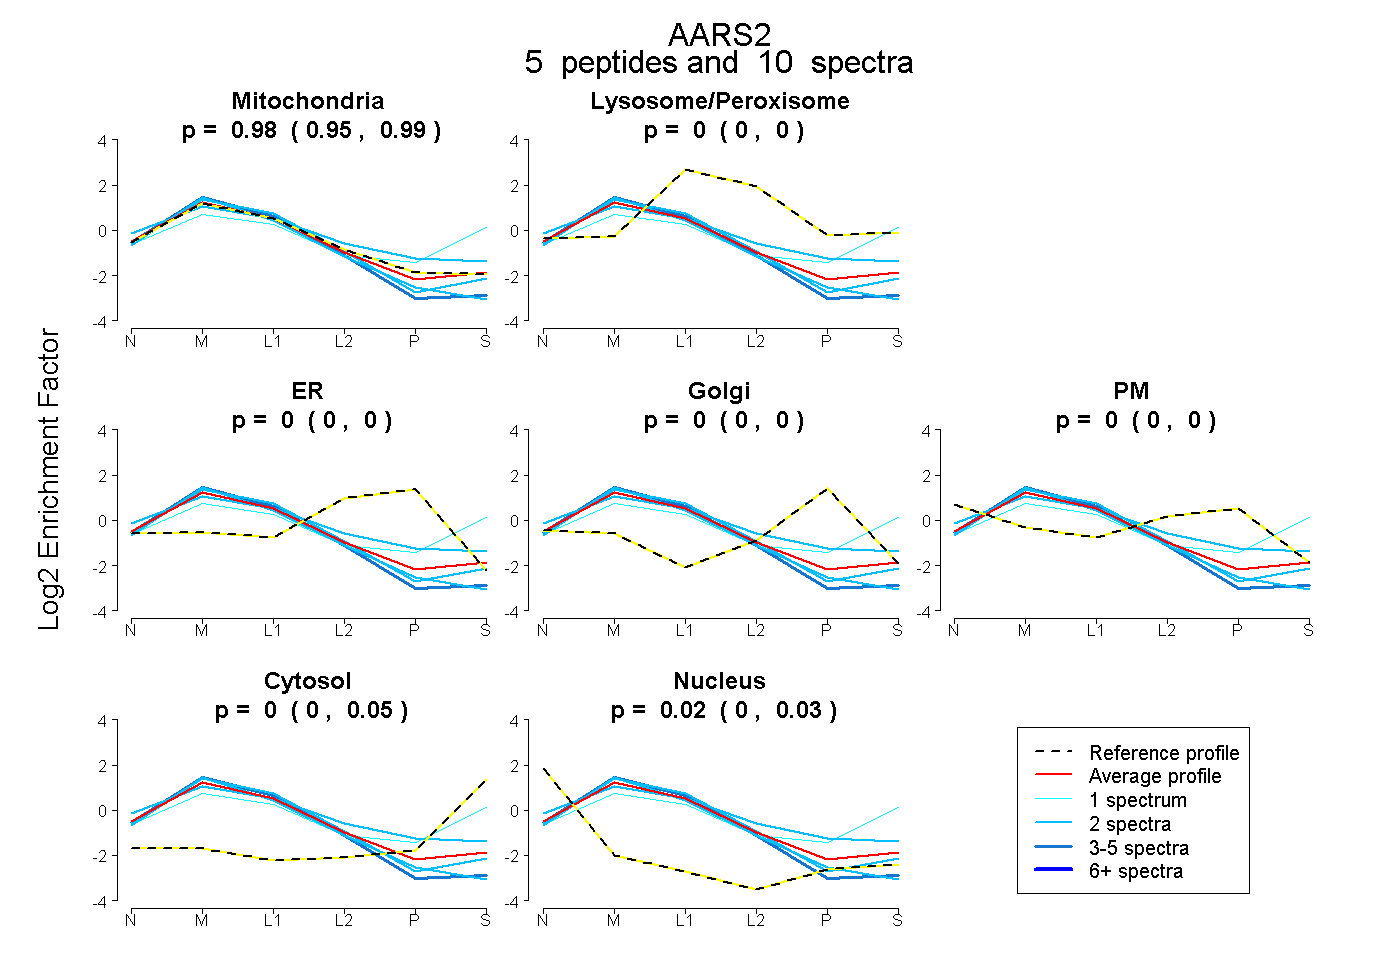 |
0.981
0.947 | 0.990 |
|
0.000
0.000 | 0.000 |
|
0.000
0.000 | 0.000 |
0.000
0.000 | 0.000 |
0.000
0.000 | 0.000 |
0.003
0.000 | 0.046 |
0.016
0.000 | 0.028 |
|
| 2 spectra, VVADHIR |
0.738 |
|
0.101 |
|
0.000 |
0.000 |
0.138 |
0.023 |
0.000 |
|
| 1 spectrum, LVAVLQGK |
0.518 |
|
0.170 |
|
0.000 |
0.000 |
0.000 |
0.312 |
0.000 |
|
| 3 spectra, DAFLSFFR |
0.972 |
|
0.000 |
|
0.000 |
0.000 |
0.000 |
0.000 |
0.028 |
|
| 2 spectra, TGLDPDLETR |
1.000 |
|
0.000 |
|
0.000 |
0.000 |
0.000 |
0.000 |
0.000 |
|
| 2 spectra, LVPSASVRPR |
0.973 |
|
0.000 |
|
0.000 |
0.000 |
0.000 |
0.000 |
0.027 |
|
| | | Plot |
|
Lyso |
|
|
|
|
|
|
|
Other |
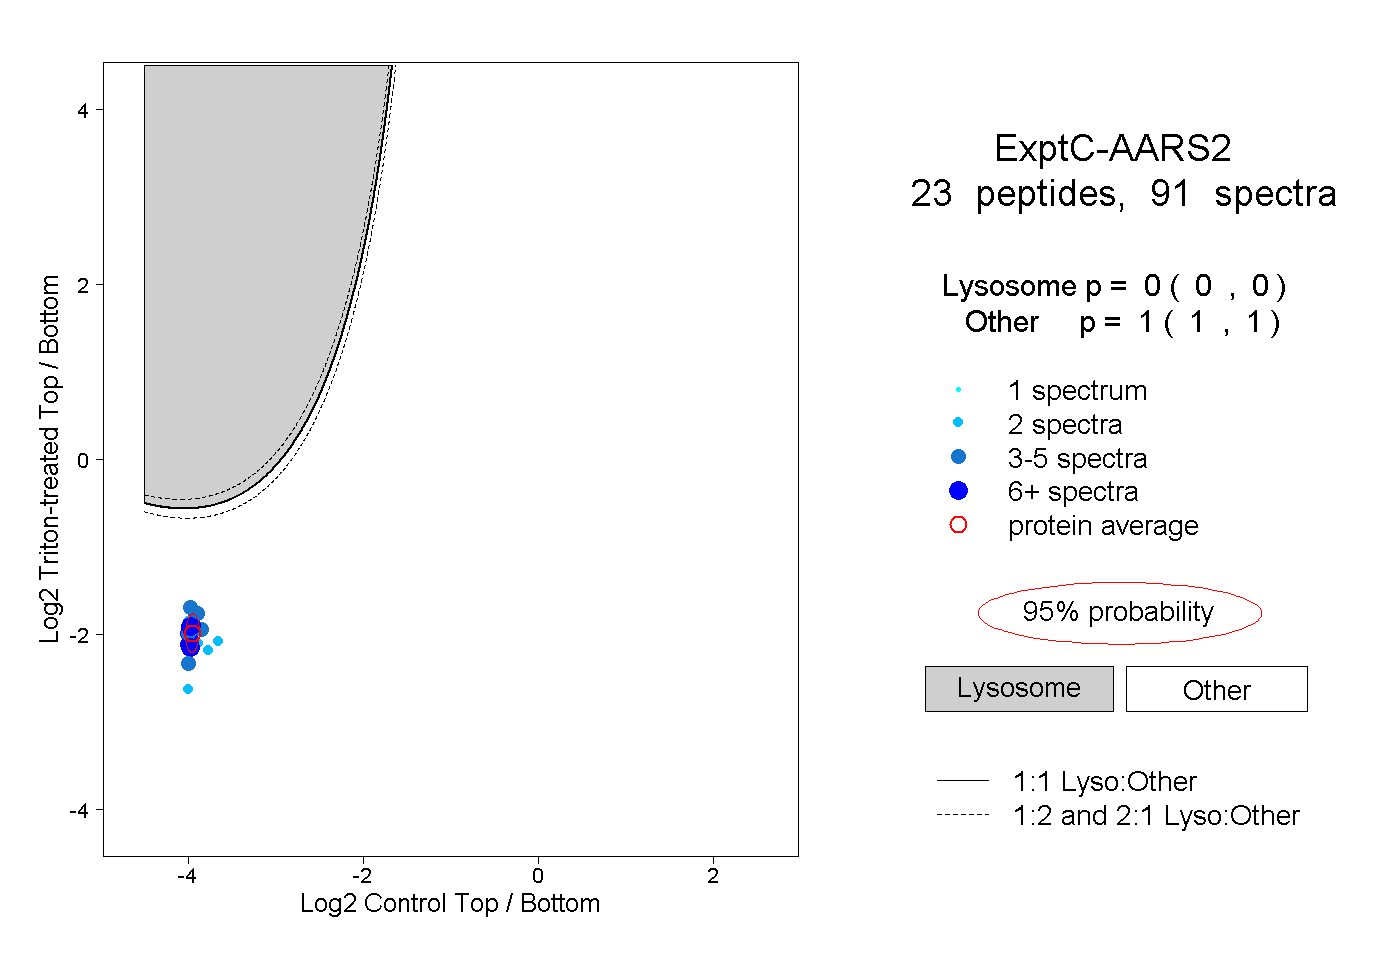
| Expt C |
23
peptides |
91
spectra |
 |
|
0.000
0.000 | 0.000 |
|
|
|
|
|
|
|
1.000
1.000 | 1.000 |
| | | Plot |
|
Lyso |
|
|
|
|
|
|
|
Other |
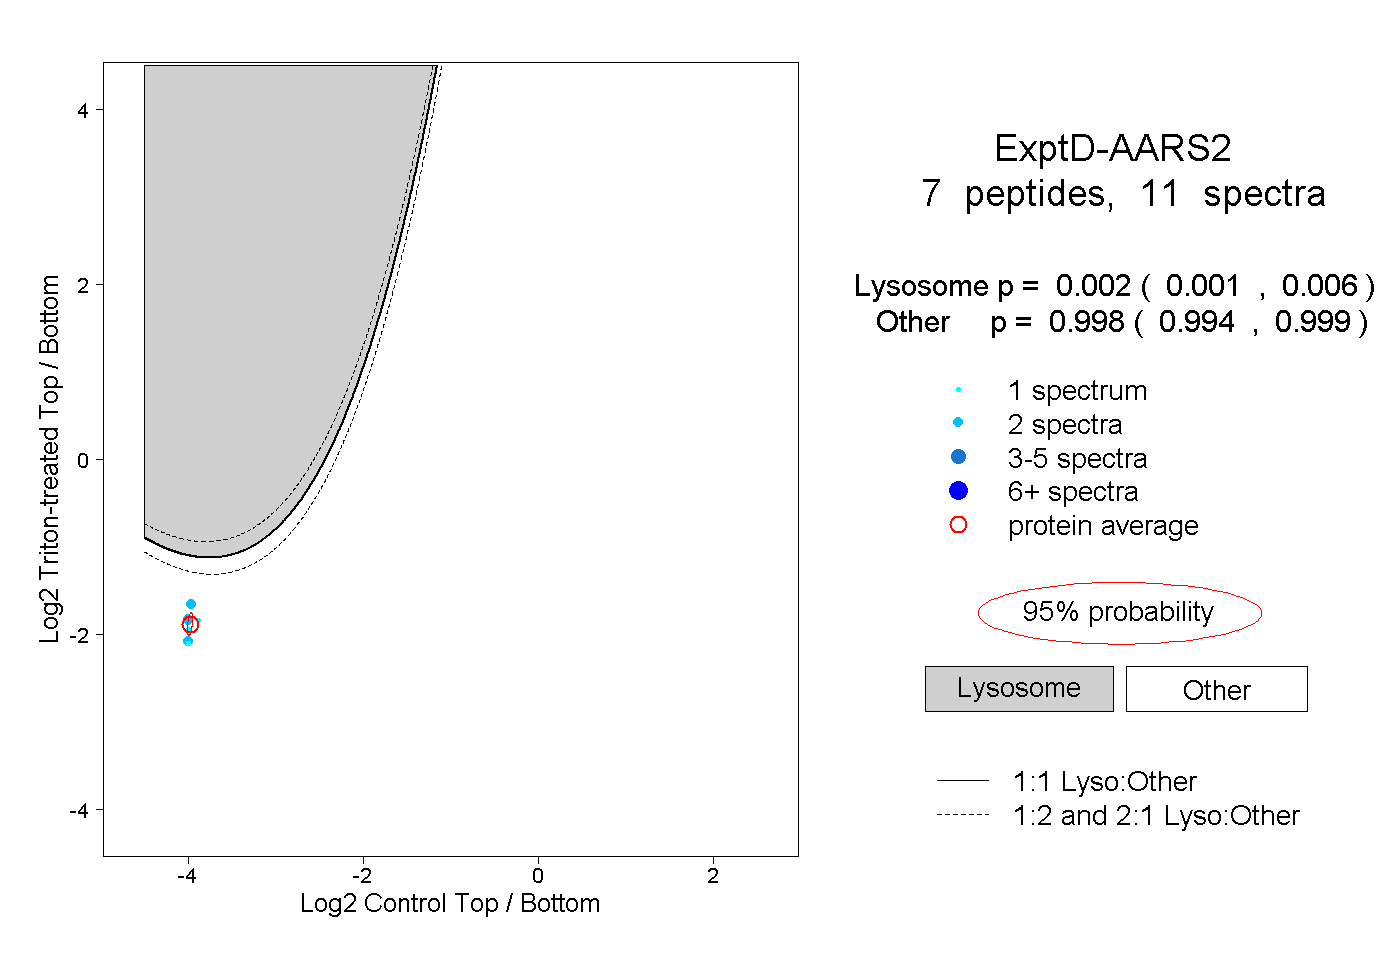
| Expt D |
7
peptides |
11
spectra |
 |
|
0.002
0.001 | 0.006 |
|
|
|
|
|
|
|
0.998
0.994 | 0.999 |