 4
4peptides
spectra
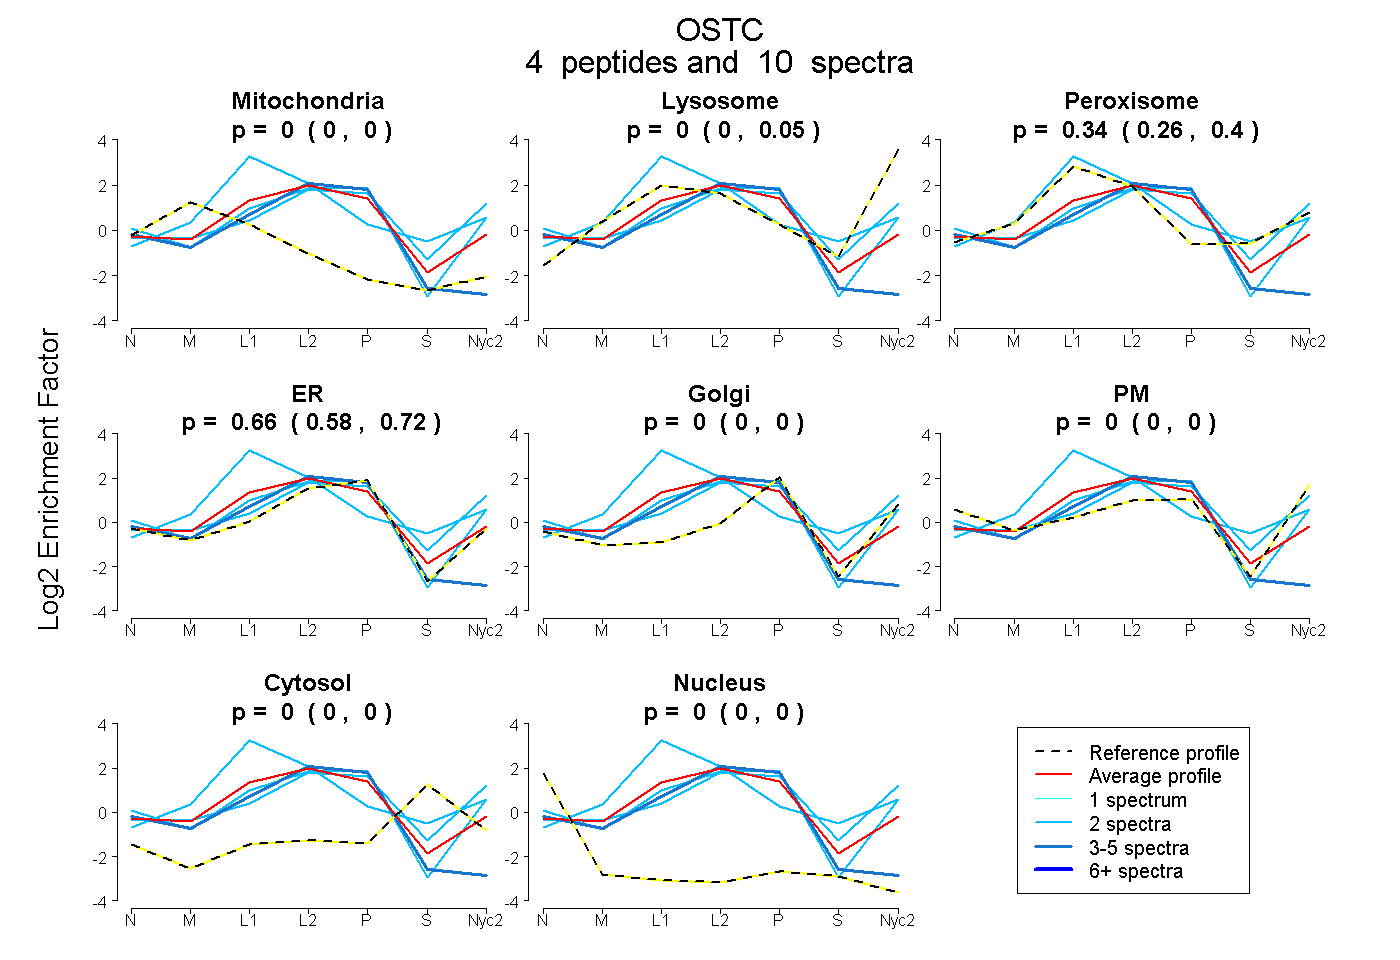
0.000 | 0.000
0.000 | 0.045
0.256 | 0.405
0.578 | 0.718
0.000 | 0.000
0.000 | 0.000
0.000 | 0.000
0.000 | 0.000
1peptide
spectra
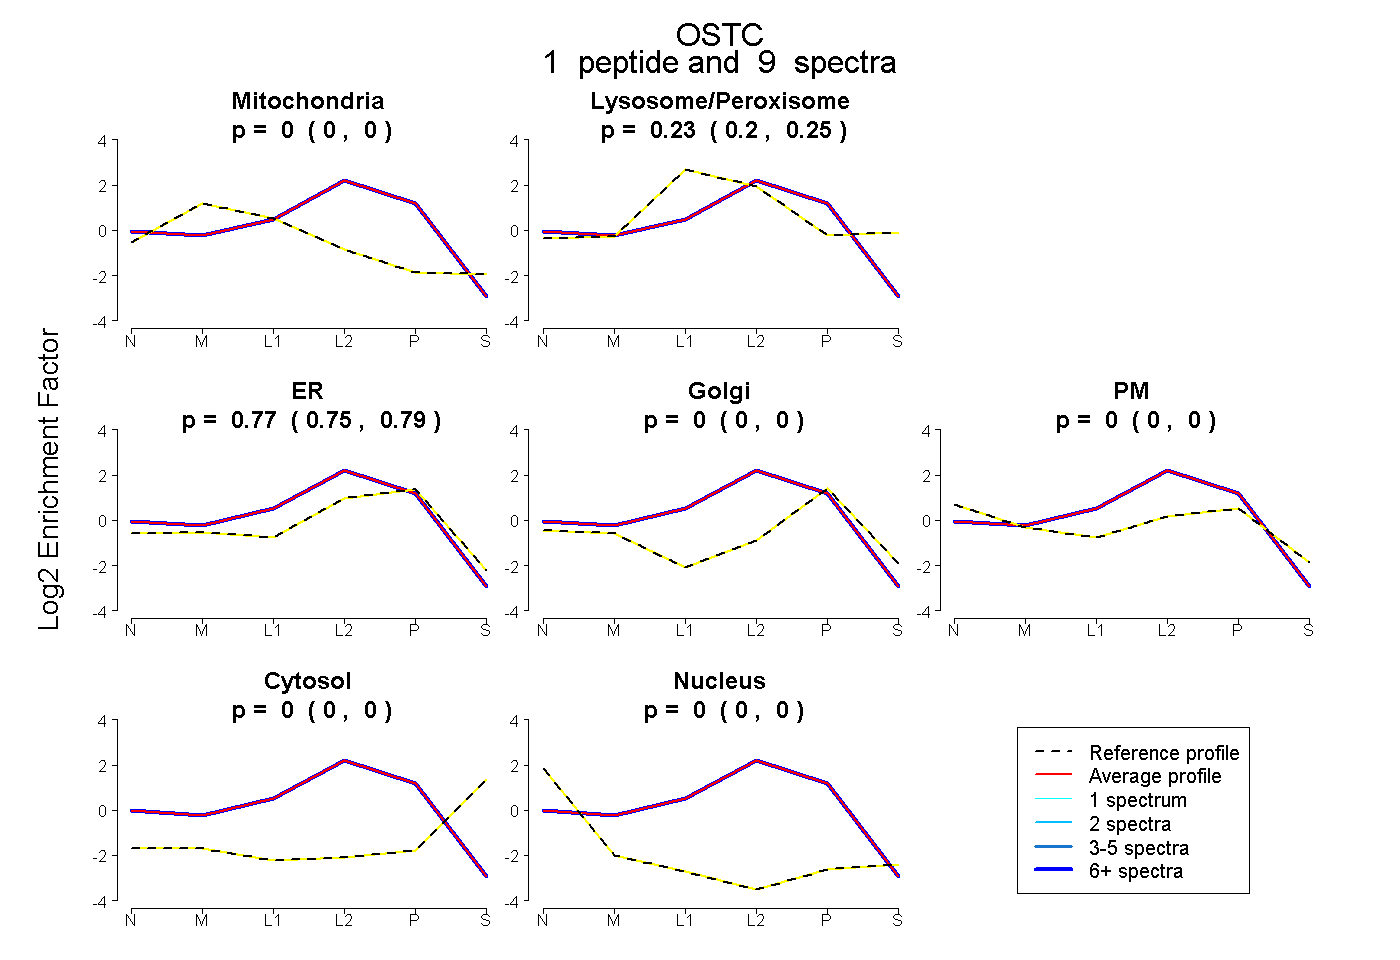
0.000 | 0.000
0.202 | 0.249
0.747 | 0.794
0.000 | 0.000
0.000 | 0.000
0.000 | 0.000
0.000 | 0.000
3peptides
spectra
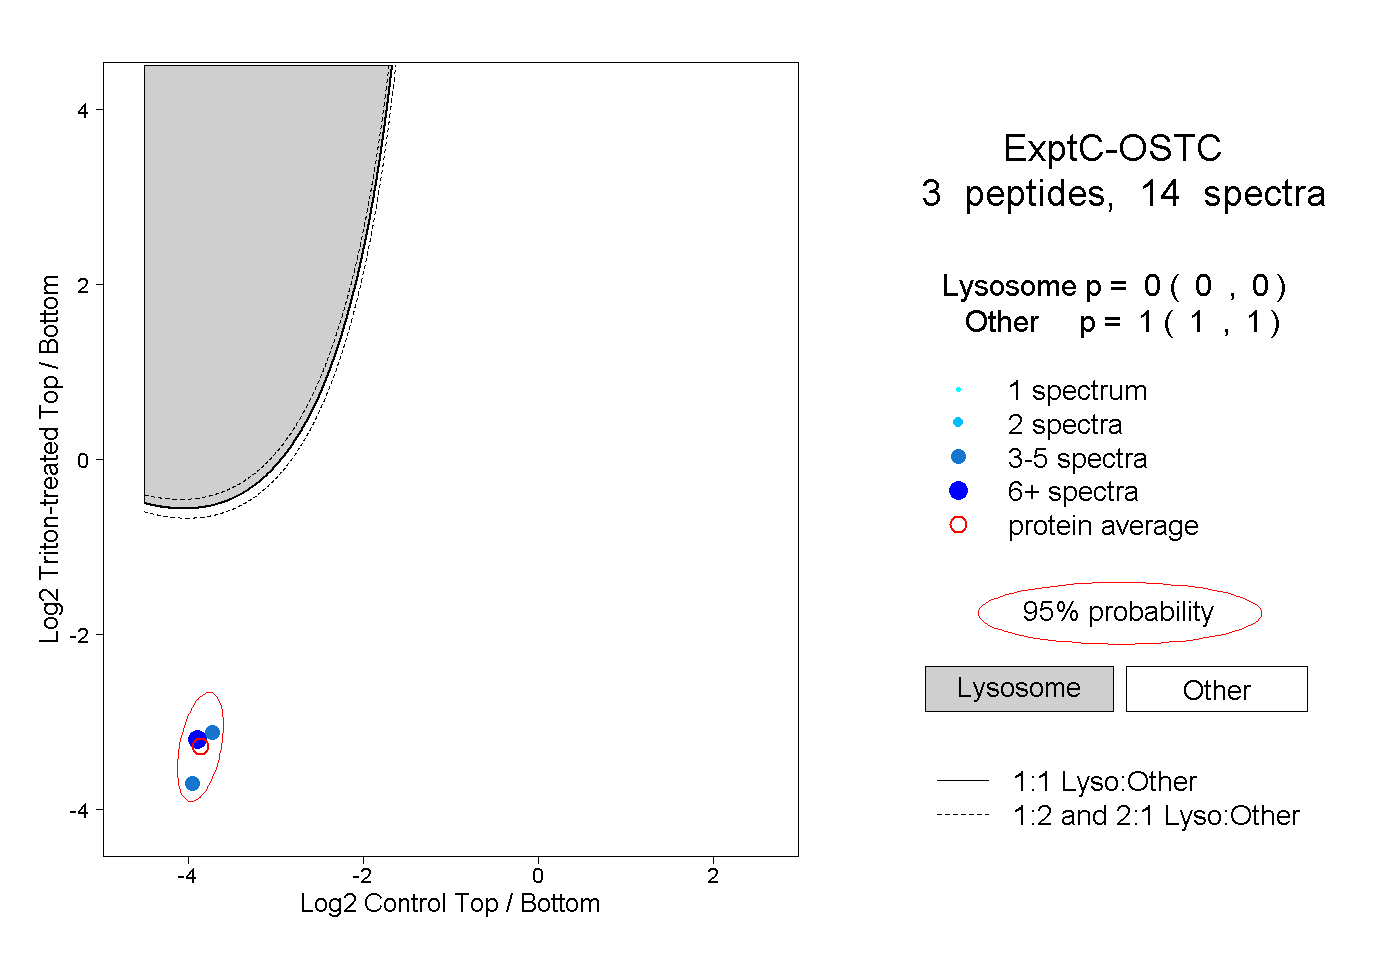
0.000 | 0.000
1.000 | 1.000
1peptide
spectra
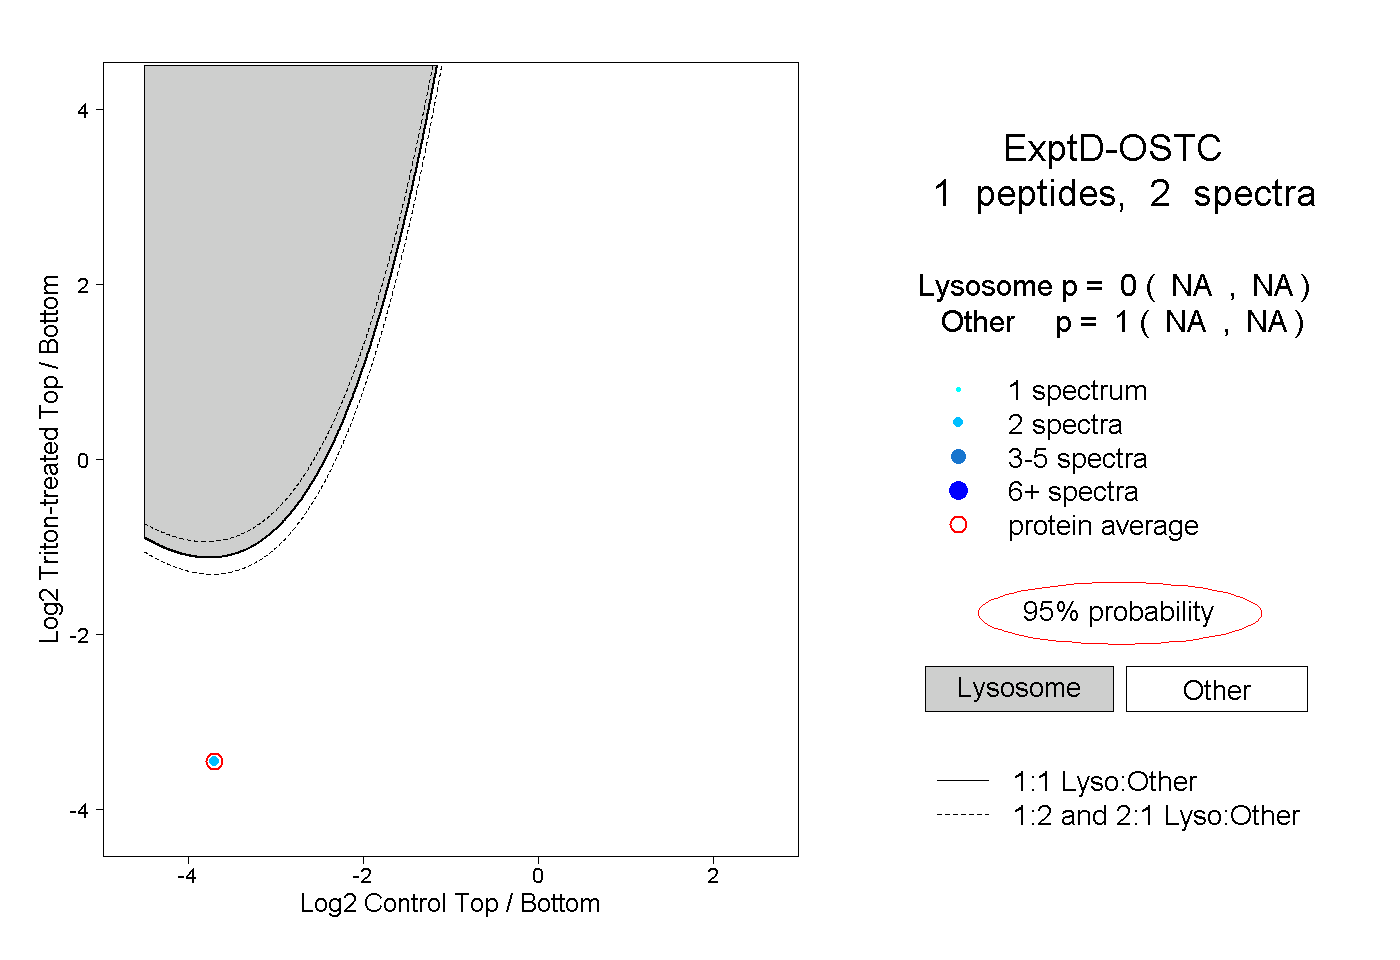
NA | NA
NA | NA