 2
2peptides
spectra
0.000 | 0.142
0.000 | 0.000
0.000 | 0.055
0.123 | 0.367
0.000 | 0.044
0.000 | 0.000
0.000 | 0.127
0.549 | 0.683
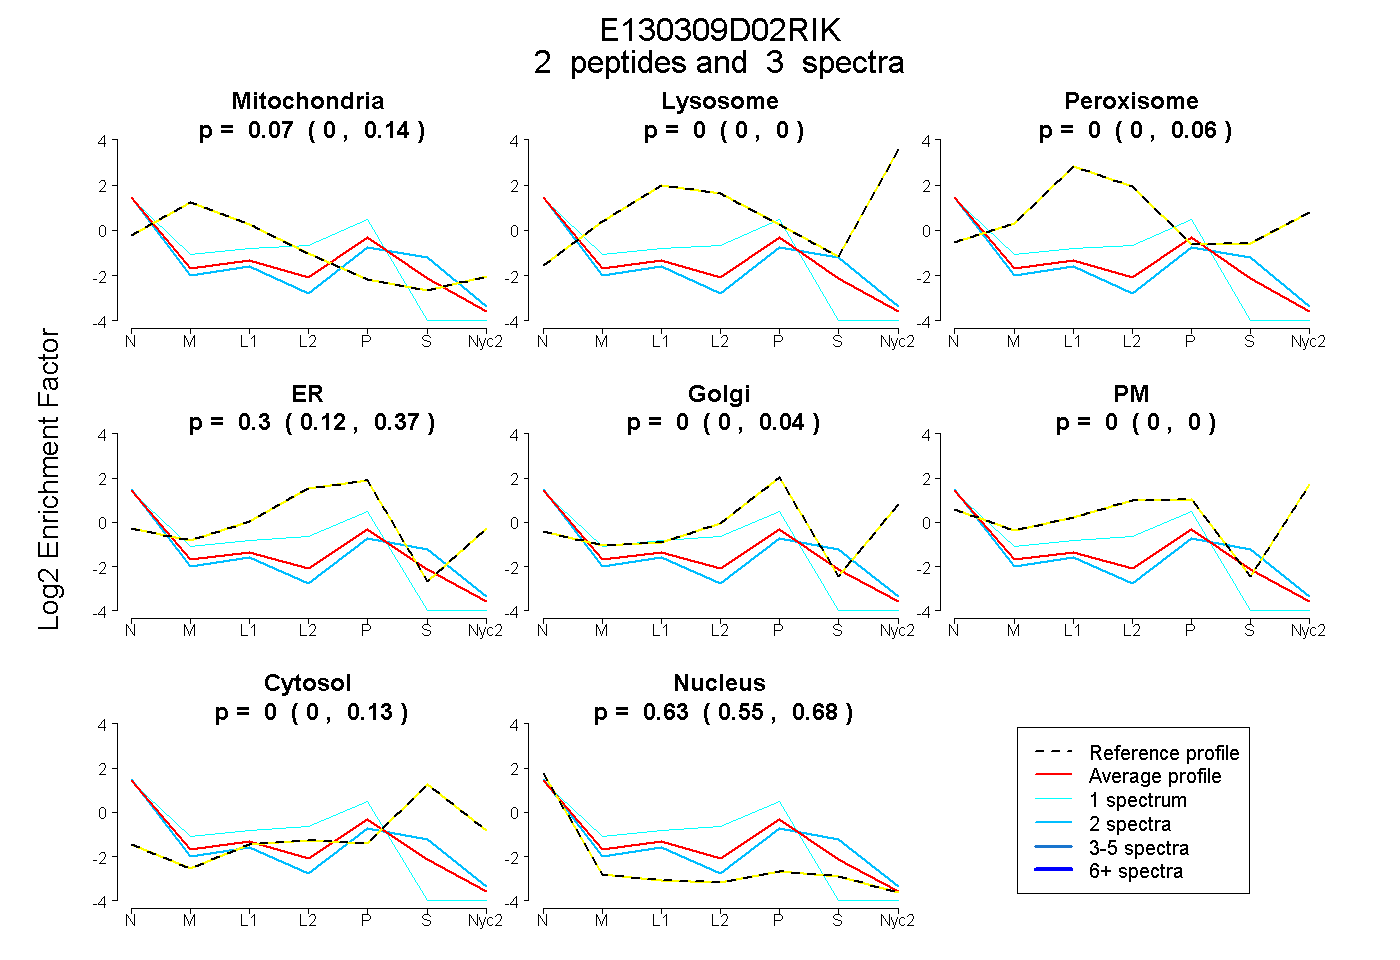
| Plot | Mito | Lyso | Perox | ER | Golgi | PM | Cytosol | Nucleus | |||||
| Expt A |
2 peptides |
3 spectra |
|
0.068 0.000 | 0.142 |
0.000 0.000 | 0.000 |
0.000 0.000 | 0.055 |
0.300 0.123 | 0.367 |
0.000 0.000 | 0.044 |
0.000 0.000 | 0.000 |
0.000 0.000 | 0.127 |
0.632 0.549 | 0.683 |
| 1 spectrum, QIIFSSLFSPQGNK | 0.079 | 0.000 | 0.000 | 0.454 | 0.000 | 0.000 | 0.000 | 0.467 | ||
| 2 spectra, QIFSASPR | 0.036 | 0.000 | 0.000 | 0.137 | 0.000 | 0.000 | 0.197 | 0.630 |