7
7peptides
spectra
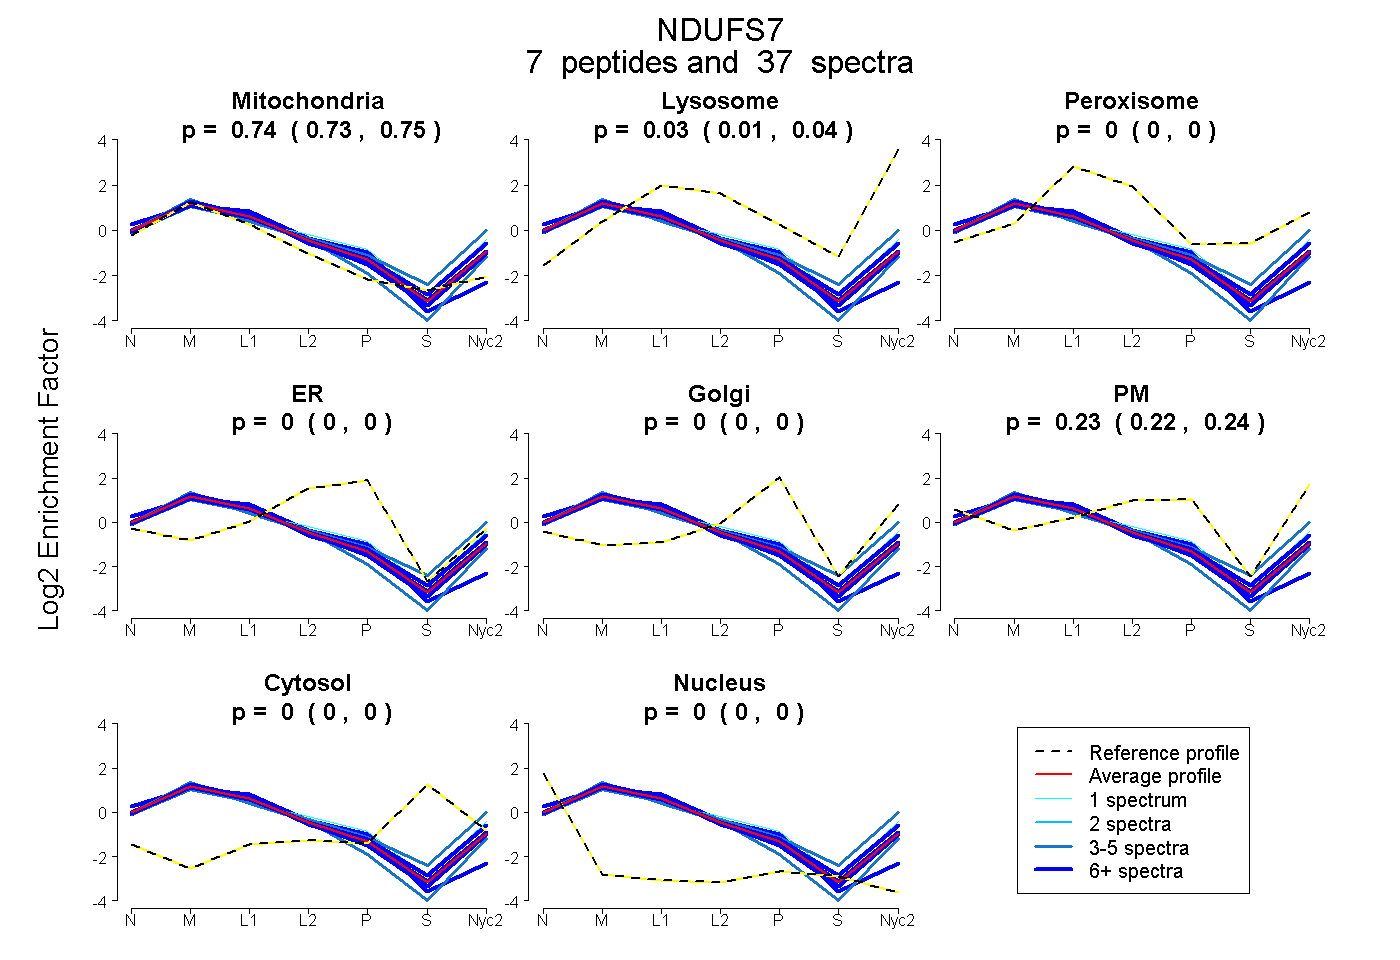
0.731 | 0.751
0.014 | 0.037
0.000 | 0.000
0.000 | 0.000
0.000 | 0.000
0.221 | 0.240
0.000 | 0.000
0.000 | 0.000
6peptides
spectra
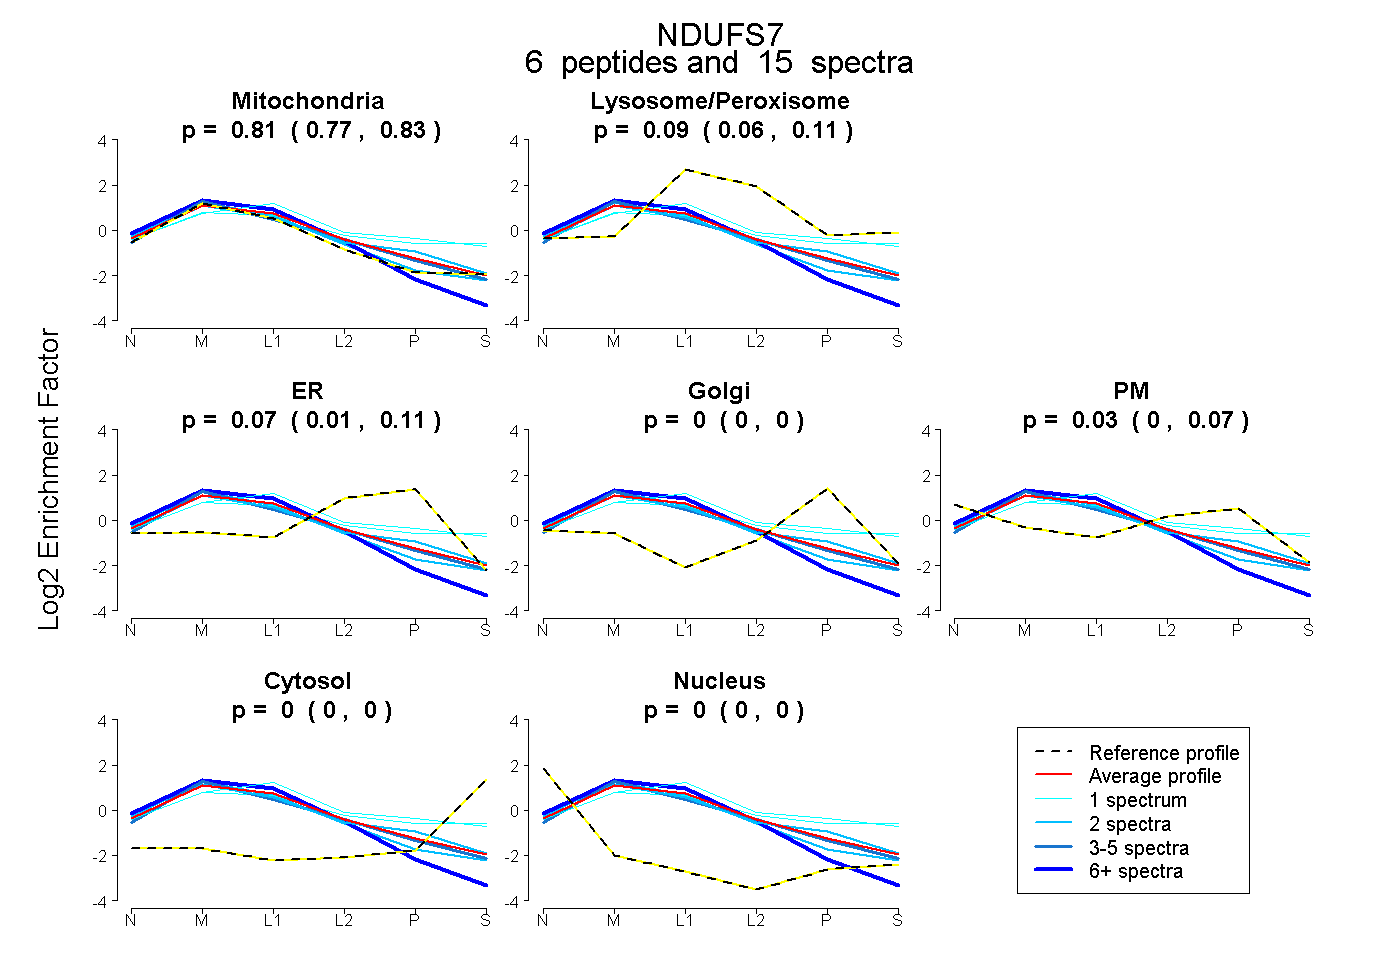
0.771 | 0.832
0.060 | 0.114
0.014 | 0.115
0.000 | 0.000
0.000 | 0.072
0.000 | 0.000
0.000 | 0.000