 7
7peptides
spectra
0.731 | 0.751
0.014 | 0.037
0.000 | 0.000
0.000 | 0.000
0.000 | 0.000
0.221 | 0.240
0.000 | 0.000
0.000 | 0.000
| Plot | Mito | Lyso | Perox | ER | Golgi | PM | Cytosol | Nucleus | |||||
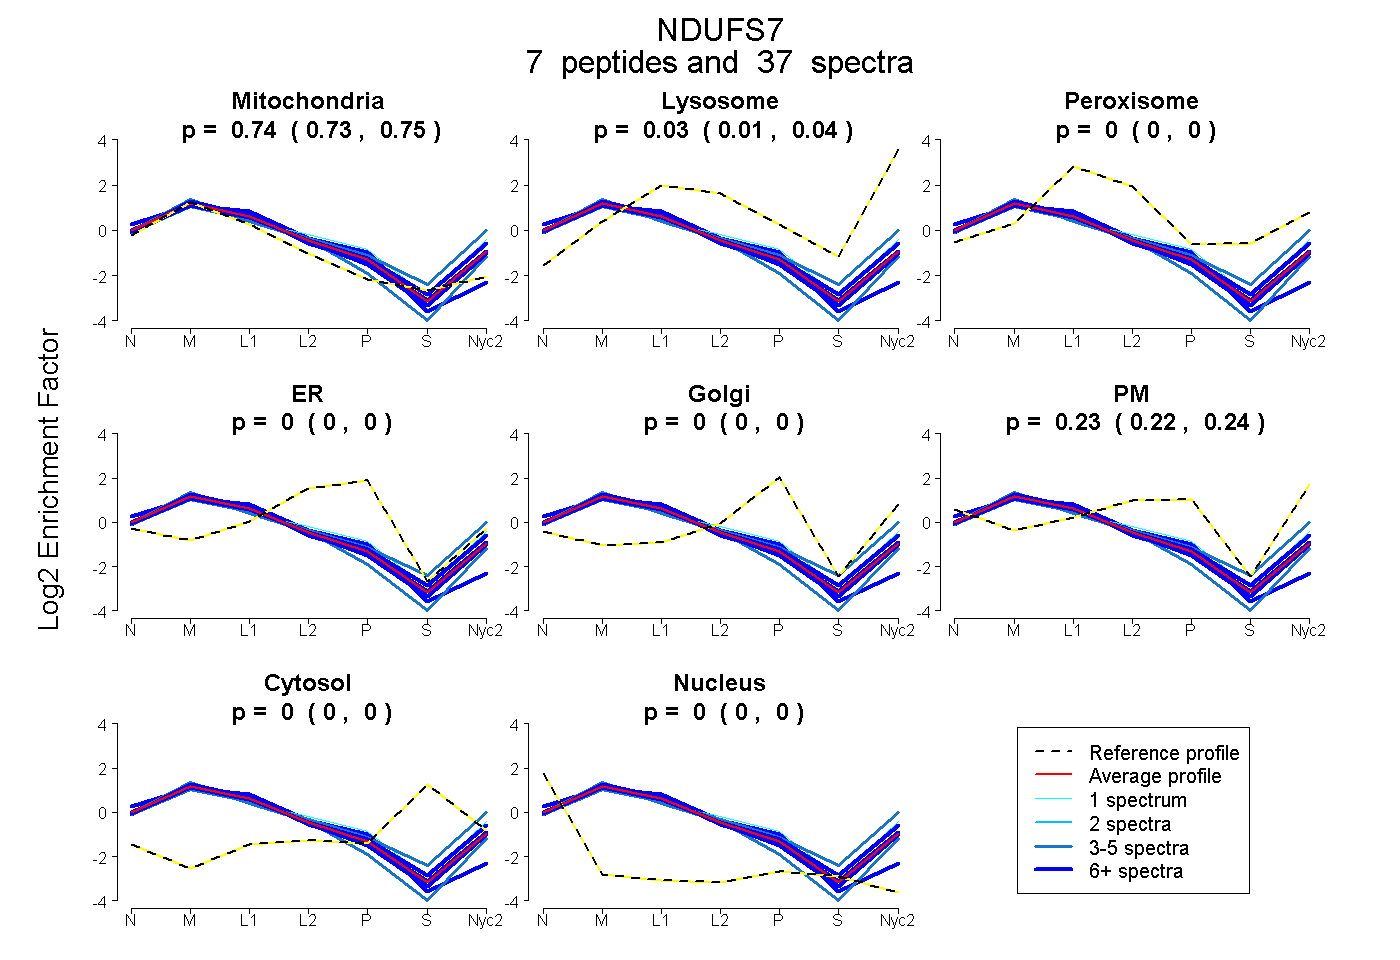
| Expt A |
7 peptides |
37 spectra |
|
0.742 0.731 | 0.751 |
0.026 0.014 | 0.037 |
0.000 0.000 | 0.000 |
0.000 0.000 | 0.000 |
0.000 0.000 | 0.000 |
0.232 0.221 | 0.240 |
0.000 0.000 | 0.000 |
0.000 0.000 | 0.000 |
| 1 spectrum, FGVVFR | 0.623 | 0.076 | 0.000 | 0.000 | 0.000 | 0.301 | 0.000 | 0.000 | ||
| 5 spectra, QADVMIVAGTLTNK | 0.614 | 0.178 | 0.000 | 0.000 | 0.000 | 0.208 | 0.000 | 0.000 | ||
| 3 spectra, LDDLINWAR | 0.840 | 0.000 | 0.000 | 0.000 | 0.000 | 0.160 | 0.000 | 0.000 | ||
| 7 spectra, VYDQMPEPR | 0.697 | 0.085 | 0.000 | 0.000 | 0.000 | 0.219 | 0.000 | 0.000 | ||
| 6 spectra, AGAGAVVPKPSHLPR | 0.792 | 0.000 | 0.000 | 0.208 | 0.000 | 0.000 | 0.000 | 0.000 | ||
| 6 spectra, AEYVVTK | 0.756 | 0.047 | 0.000 | 0.000 | 0.000 | 0.197 | 0.000 | 0.000 | ||
| 9 spectra, MAPALR | 0.780 | 0.038 | 0.000 | 0.000 | 0.000 | 0.182 | 0.000 | 0.000 |
| Plot | Mito | Lyso or Perox | ER | Golgi | PM | Cytosol | Nucleus | ||||||
| Expt B |
6 peptides |
15 spectra |
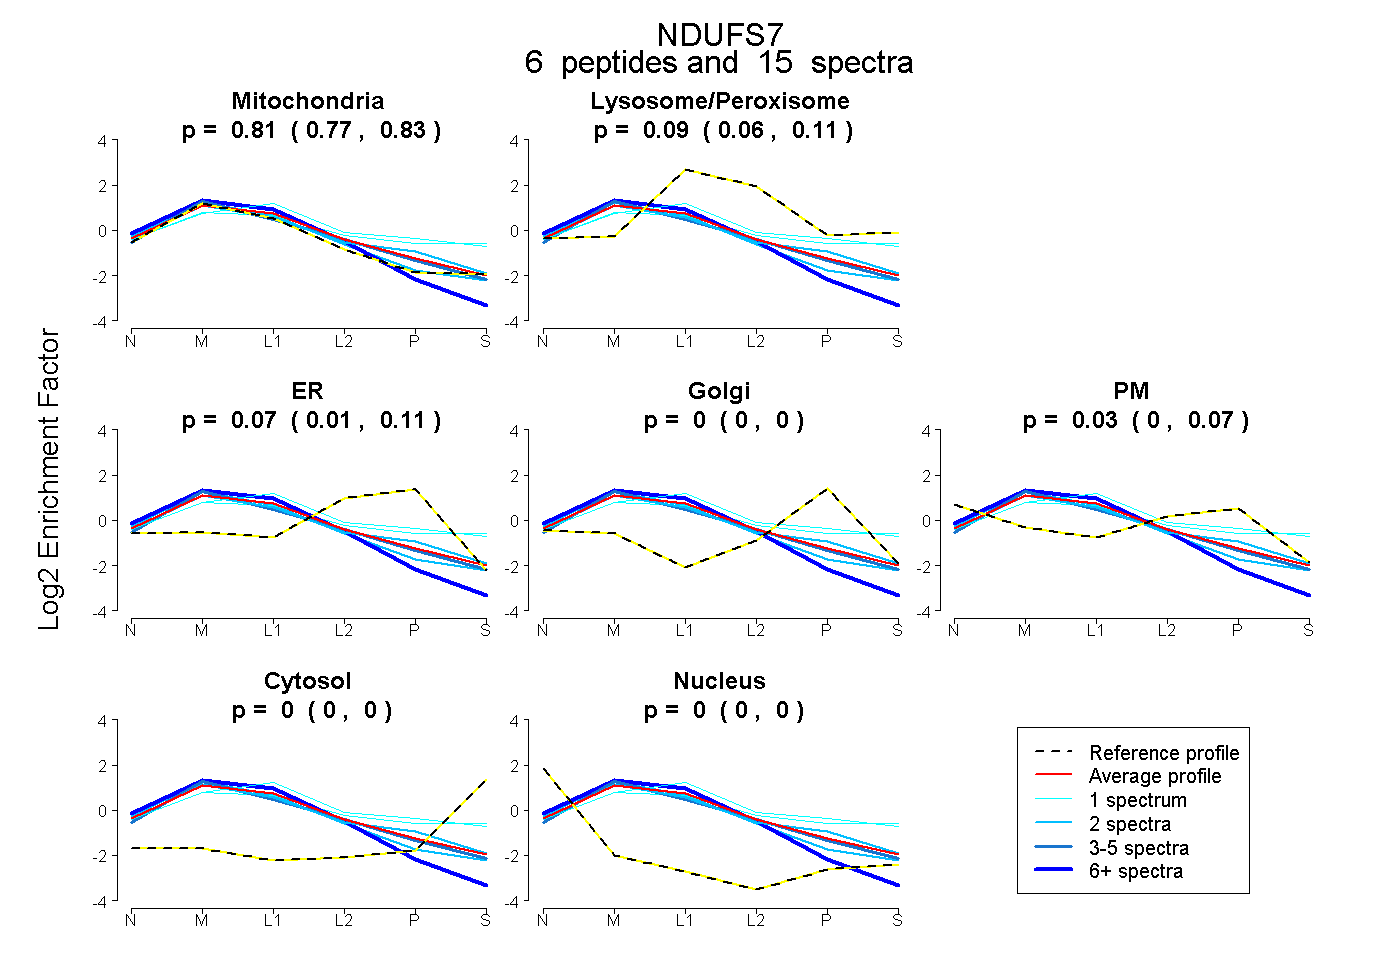 |
0.805 0.771 | 0.832 |
0.090 0.060 | 0.114 |
0.071 0.014 | 0.115 |
0.000 0.000 | 0.000 |
0.034 0.000 | 0.072 |
0.000 0.000 | 0.000 |
0.000 0.000 | 0.000 |
|||
| Plot | Lyso | Other | |||||||||||
| Expt C |
6 peptides |
105 spectra |
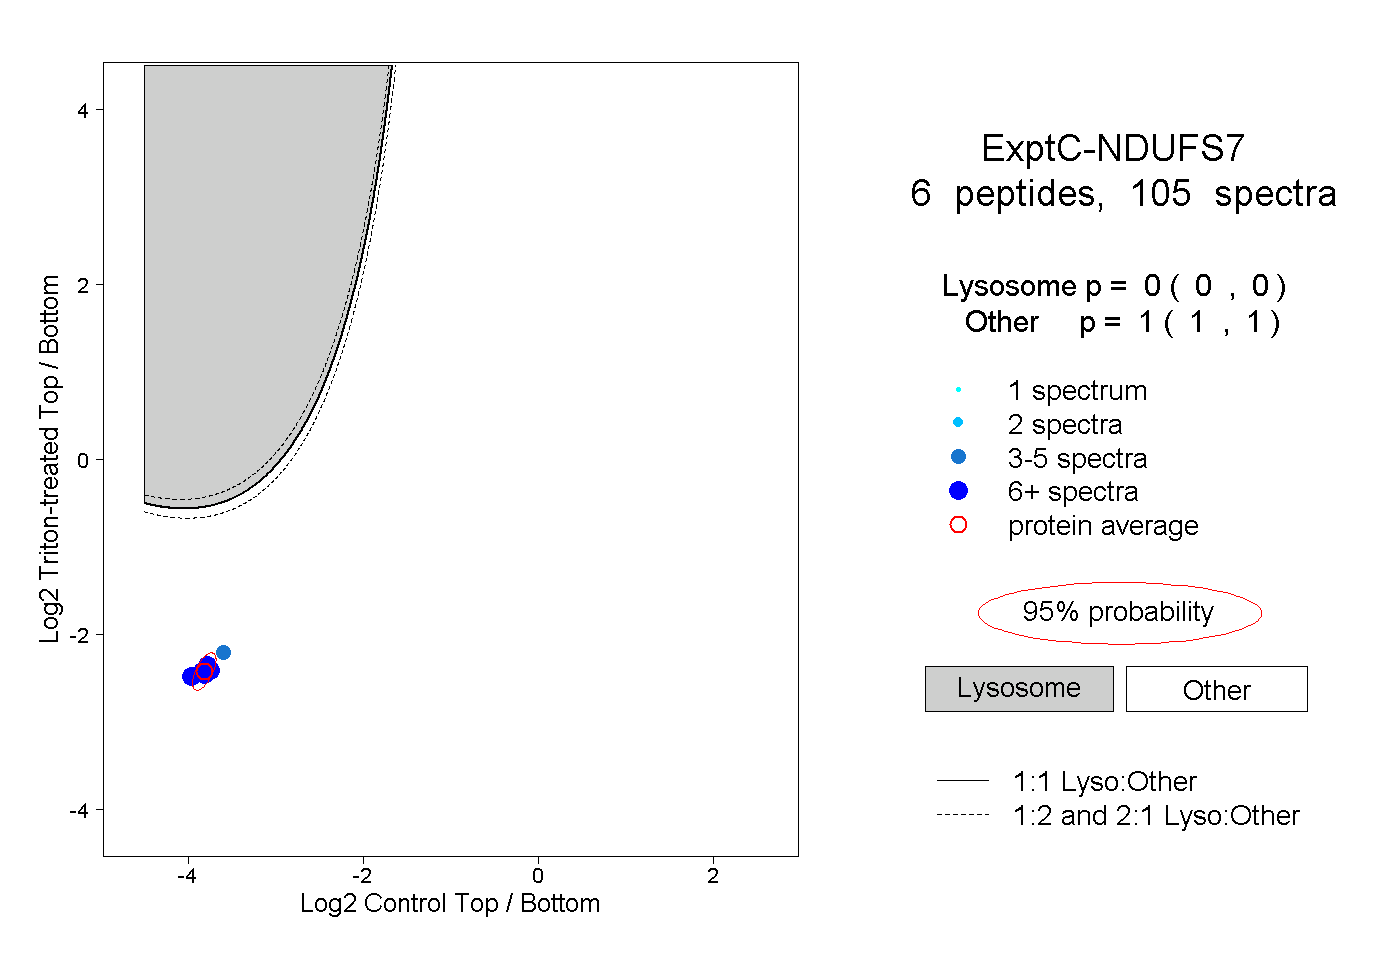 |
0.000 0.000 | 0.000 |
1.000 1.000 | 1.000 |
||||||||
| Plot | Lyso | Other | |||||||||||
| Expt D |
4 peptides |
7 spectra |
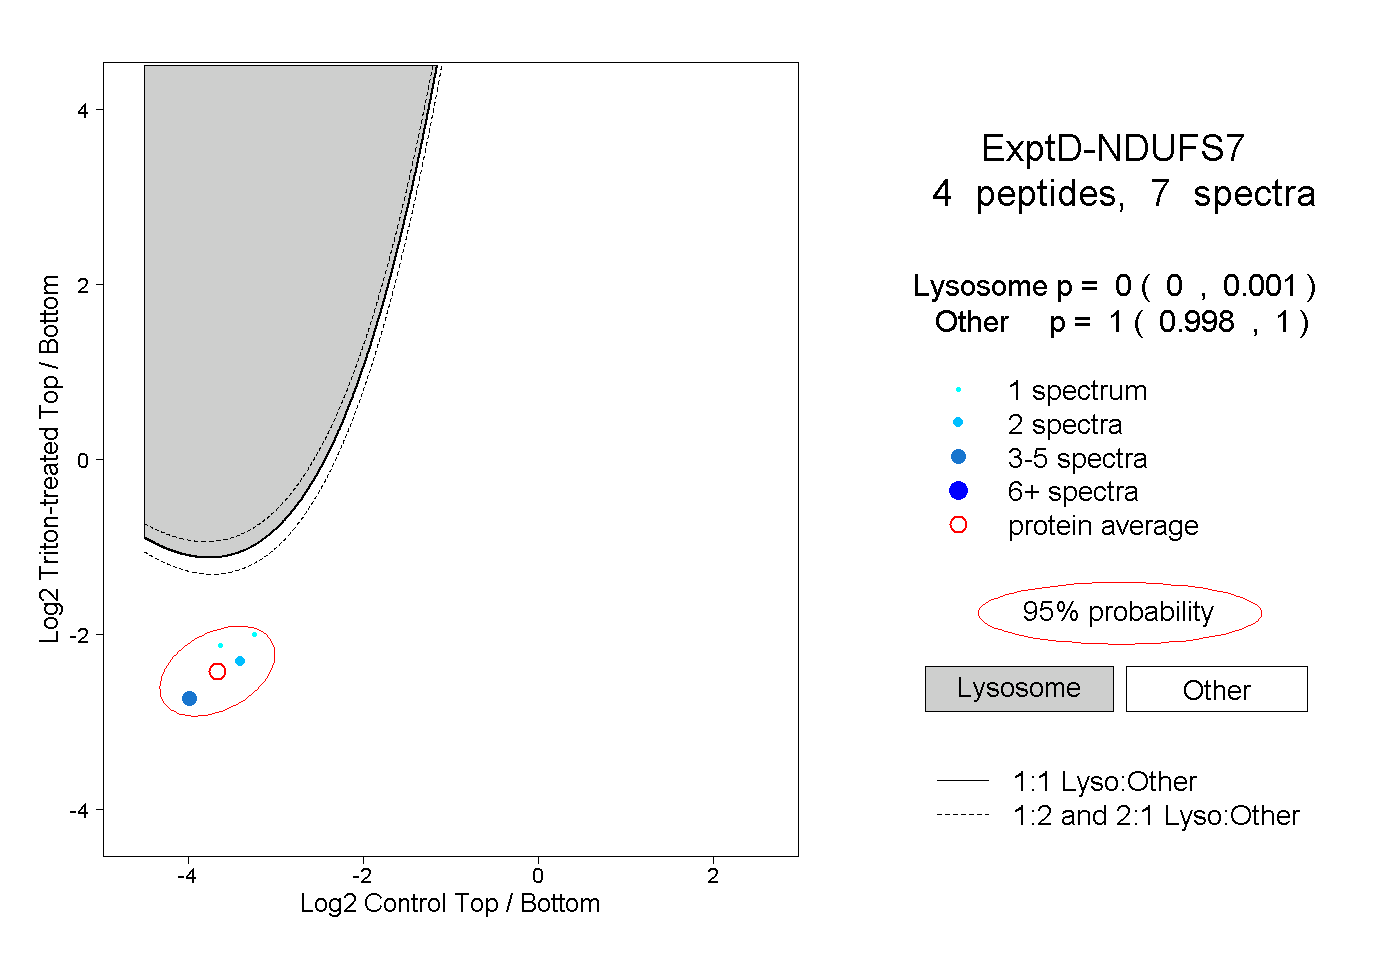 |
0.000 0.000 | 0.001 |
1.000 0.998 | 1.000 |