 2
2peptides
spectra
0.000 | 0.000
0.000 | 0.000
0.000 | 0.000
0.000 | 0.000
0.013 | 0.133
0.000 | 0.000
0.072 | 0.169
0.765 | 0.819
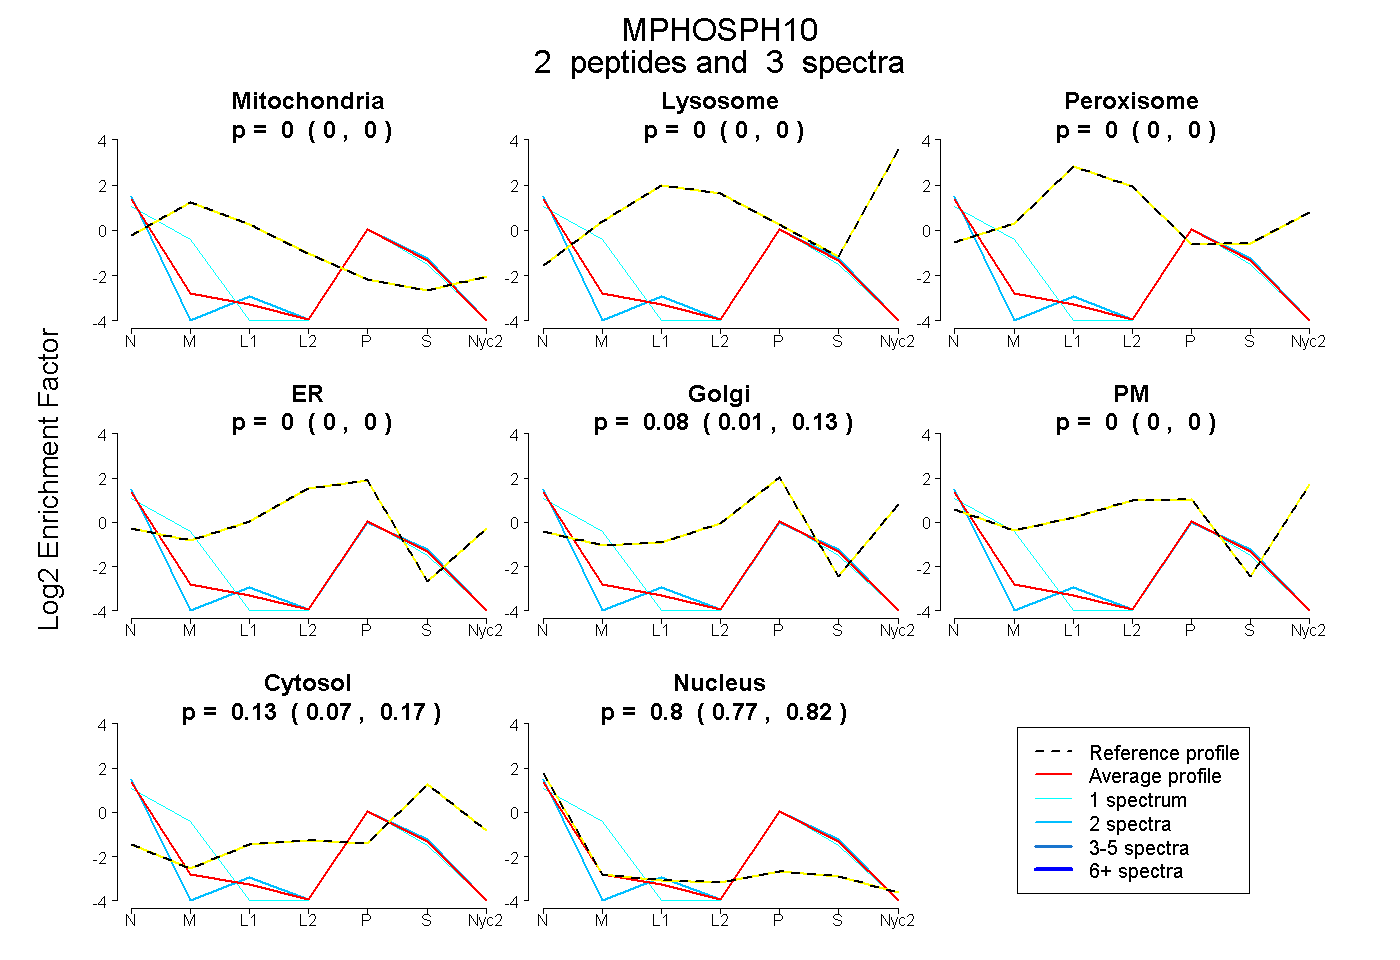
| Plot | Mito | Lyso | Perox | ER | Golgi | PM | Cytosol | Nucleus | |||||
| Expt A |
2 peptides |
3 spectra |
|
0.000 0.000 | 0.000 |
0.000 0.000 | 0.000 |
0.000 0.000 | 0.000 |
0.000 0.000 | 0.000 |
0.078 0.013 | 0.133 |
0.000 0.000 | 0.000 |
0.126 0.072 | 0.169 |
0.796 0.765 | 0.819 |
| 1 spectrum, RPENSLLEETLHFDHAVR | 0.014 | 0.000 | 0.000 | 0.000 | 0.185 | 0.000 | 0.015 | 0.786 | ||
| 2 spectra, LSEMESFLEK | 0.000 | 0.000 | 0.000 | 0.000 | 0.022 | 0.000 | 0.180 | 0.798 |