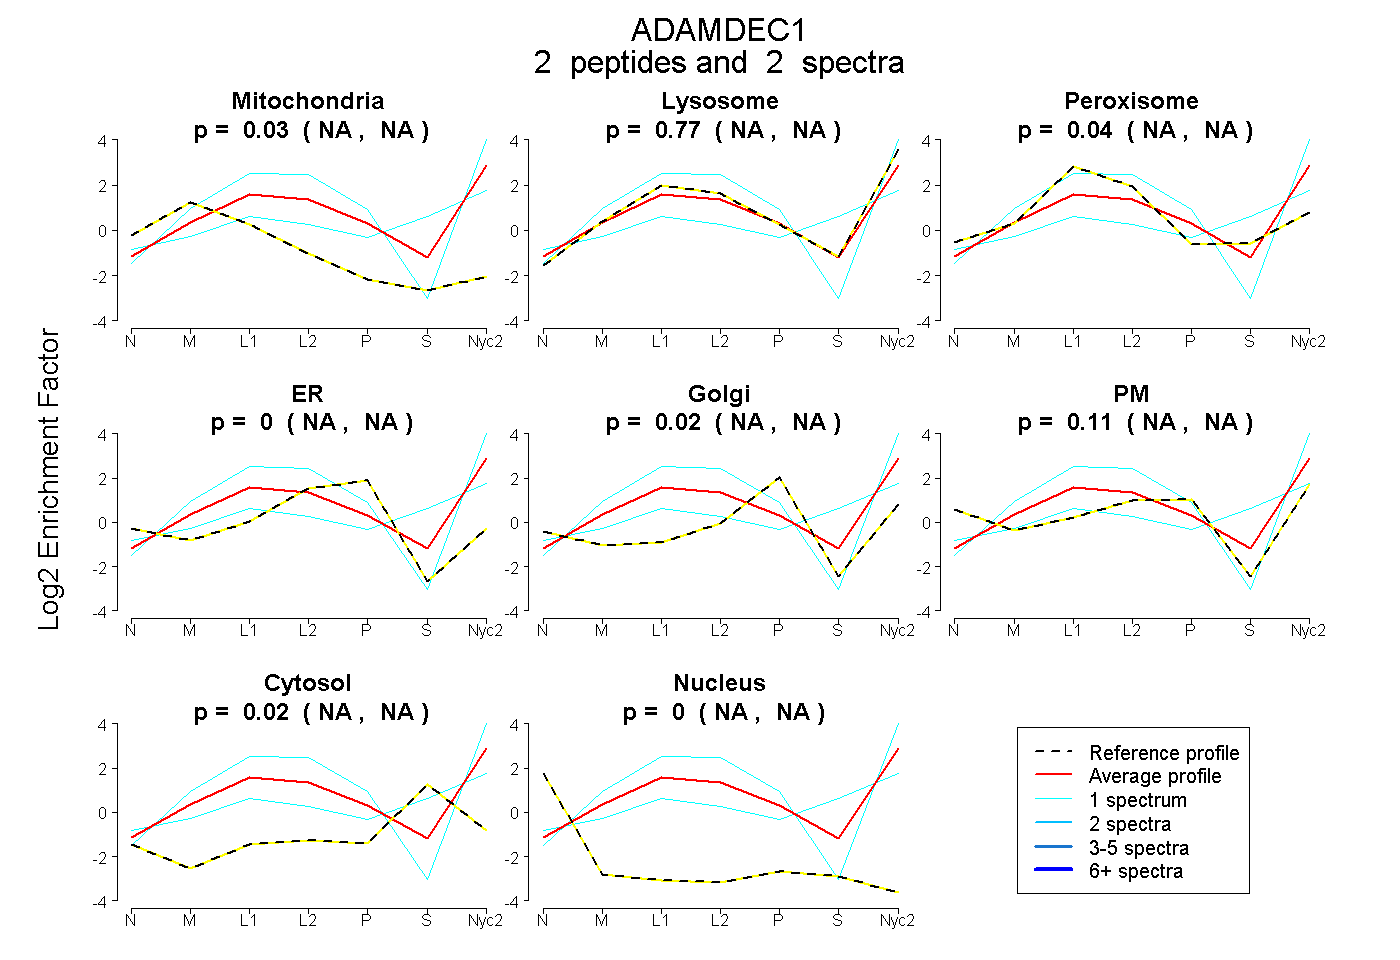
 2
2peptides
spectra
NA | NA
NA | NA
NA | NA
NA | NA
NA | NA
NA | NA
NA | NA
NA | NA
| Plot | Mito | Lyso | Perox | ER | Golgi | PM | Cytosol | Nucleus | |||||
| Expt A |
2 peptides |
2 spectra |
|
0.032 NA | NA |
0.769 NA | NA |
0.040 NA | NA |
0.000 NA | NA |
0.025 NA | NA |
0.110 NA | NA |
0.024 NA | NA |
0.000 NA | NA |
| 1 spectrum, VVPNLGATFTNFMR | 0.000 | 0.503 | 0.098 | 0.000 | 0.000 | 0.000 | 0.399 | 0.000 | ||
| 1 spectrum, NIIKPTCGNR | 0.000 | 0.977 | 0.000 | 0.015 | 0.000 | 0.007 | 0.000 | 0.000 |
| Plot | Lyso | Other | |||||||||||
| Expt C |
2 peptides |
11 spectra |
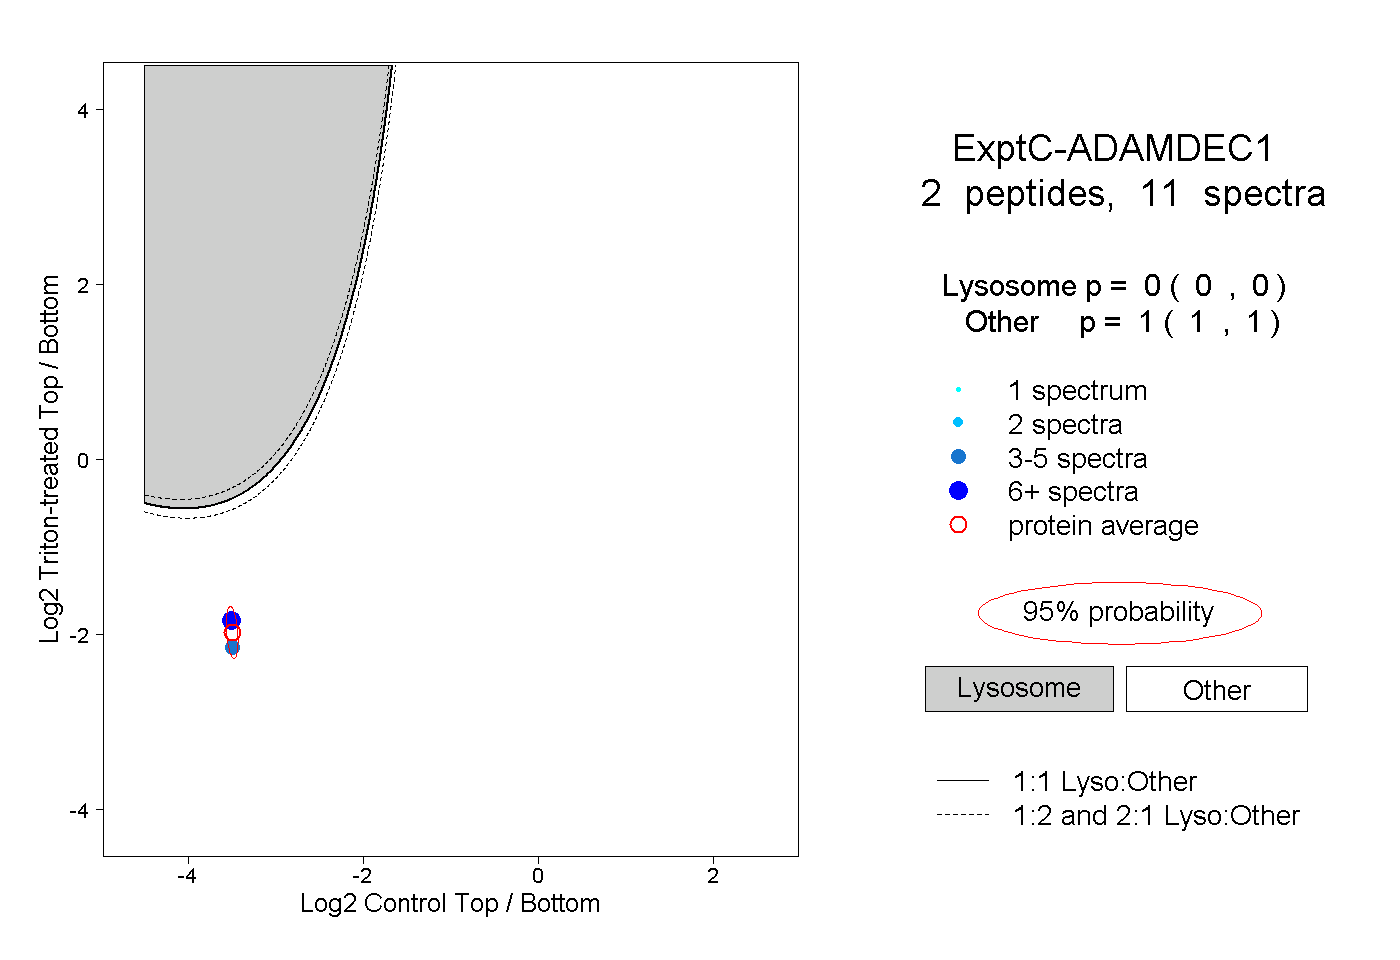 |
0.000 0.000 | 0.000 |
1.000 1.000 | 1.000 |