8
8peptides
spectra
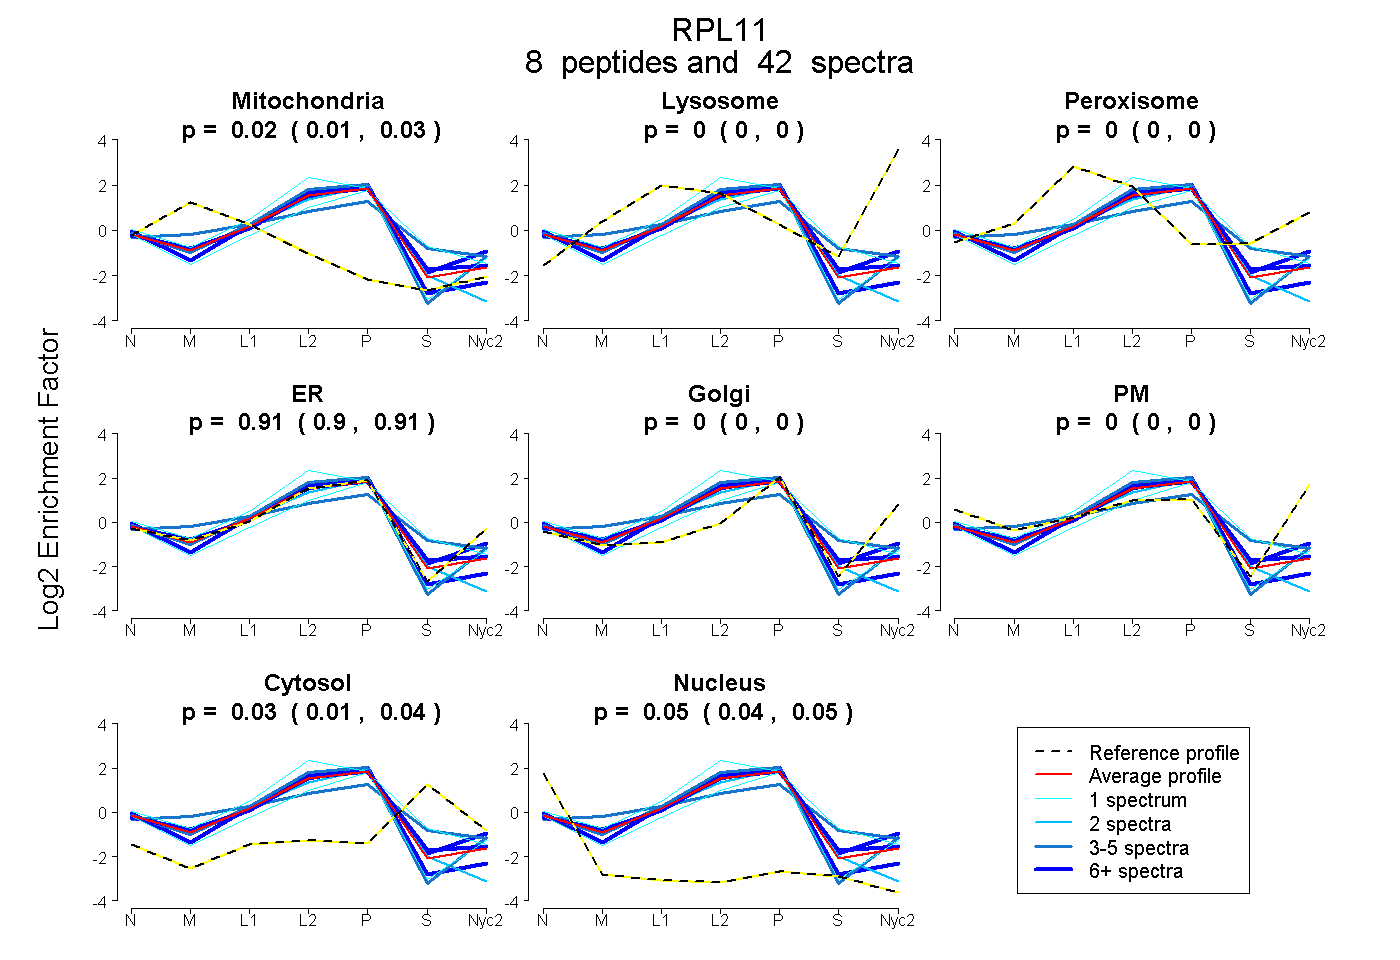
0.010 | 0.027
0.000 | 0.000
0.000 | 0.000
0.896 | 0.915
0.000 | 0.000
0.000 | 0.000
0.012 | 0.044
0.036 | 0.053
8peptides
spectra
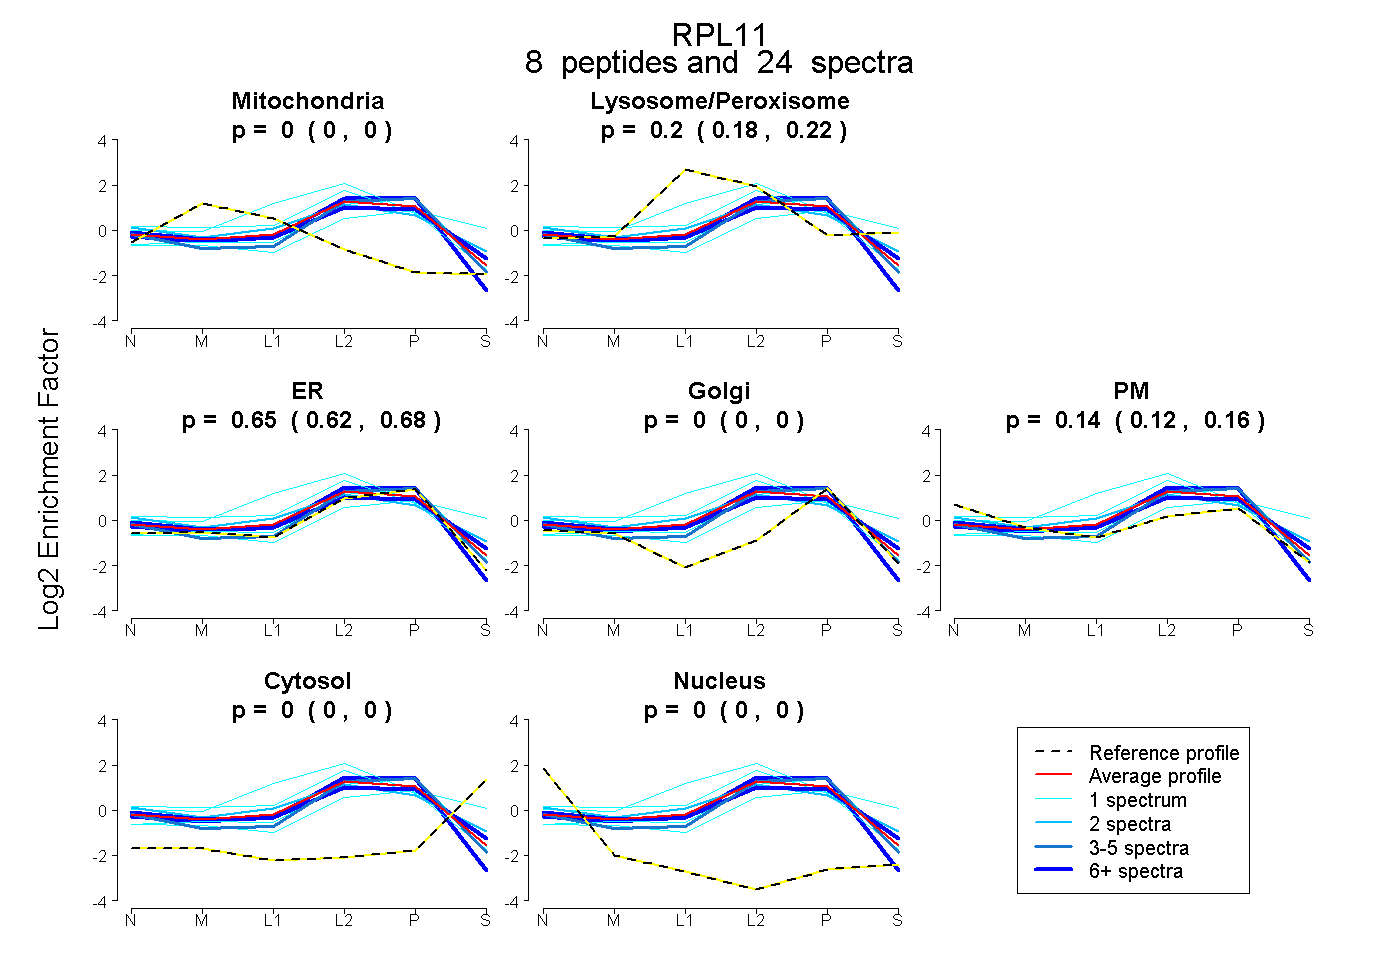
0.000 | 0.000
0.180 | 0.222
0.624 | 0.681
0.000 | 0.000
0.116 | 0.164
0.000 | 0.000
0.000 | 0.000