 8
8peptides
spectra
0.010 | 0.027
0.000 | 0.000
0.000 | 0.000
0.896 | 0.915
0.000 | 0.000
0.000 | 0.000
0.012 | 0.044
0.036 | 0.053
| Plot | Mito | Lyso | Perox | ER | Golgi | PM | Cytosol | Nucleus | |||||
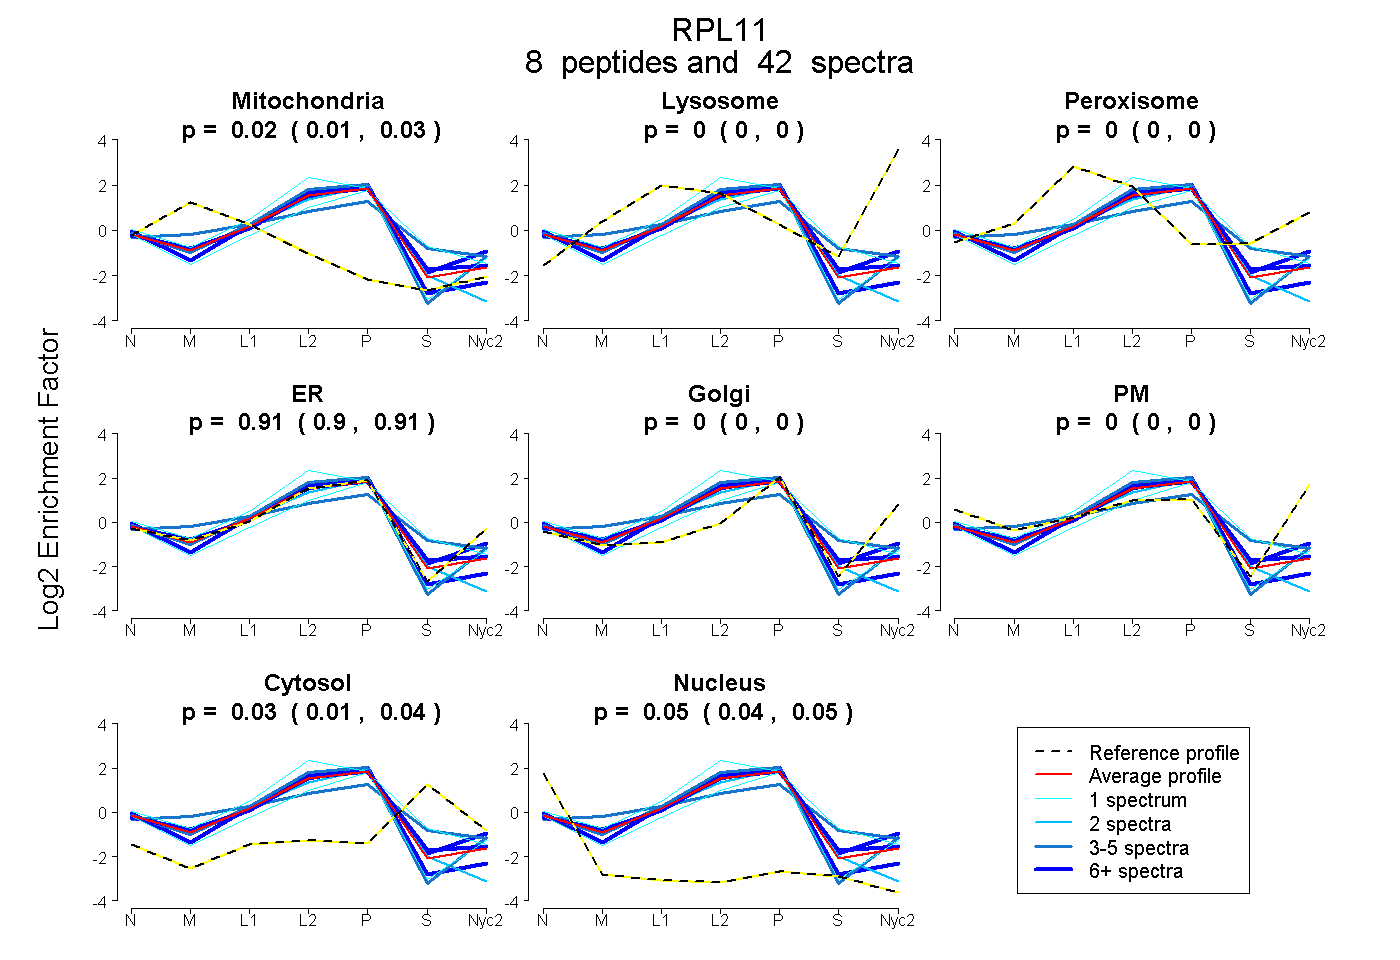
| Expt A |
8 peptides |
42 spectra |
|
0.019 0.010 | 0.027 |
0.000 0.000 | 0.000 |
0.000 0.000 | 0.000 |
0.906 0.896 | 0.915 |
0.000 0.000 | 0.000 |
0.000 0.000 | 0.000 |
0.029 0.012 | 0.044 |
0.045 0.036 | 0.053 |
| 5 spectra, SFGIR | 0.000 | 0.000 | 0.000 | 0.981 | 0.000 | 0.000 | 0.000 | 0.019 | ||
| 6 spectra, EYELR | 0.000 | 0.000 | 0.026 | 0.907 | 0.000 | 0.000 | 0.068 | 0.000 | ||
| 3 spectra, IAVHCTVR | 0.085 | 0.000 | 0.143 | 0.588 | 0.000 | 0.000 | 0.184 | 0.000 | ||
| 15 spectra, AEEILEK | 0.000 | 0.000 | 0.000 | 0.896 | 0.000 | 0.000 | 0.000 | 0.104 | ||
| 1 spectrum, YDGIILPGK | 0.000 | 0.000 | 0.000 | 0.716 | 0.000 | 0.000 | 0.284 | 0.000 | ||
| 2 spectra, LCLNICVGESGDR | 0.034 | 0.000 | 0.000 | 0.839 | 0.000 | 0.000 | 0.000 | 0.126 | ||
| 9 spectra, TGCIGAK | 0.027 | 0.000 | 0.000 | 0.880 | 0.000 | 0.000 | 0.093 | 0.000 | ||
| 1 spectrum, VLEQLTGQTPVFSK | 0.006 | 0.000 | 0.000 | 0.994 | 0.000 | 0.000 | 0.000 | 0.000 |
| Plot | Mito | Lyso or Perox | ER | Golgi | PM | Cytosol | Nucleus | ||||||
| Expt B |
8 peptides |
24 spectra |
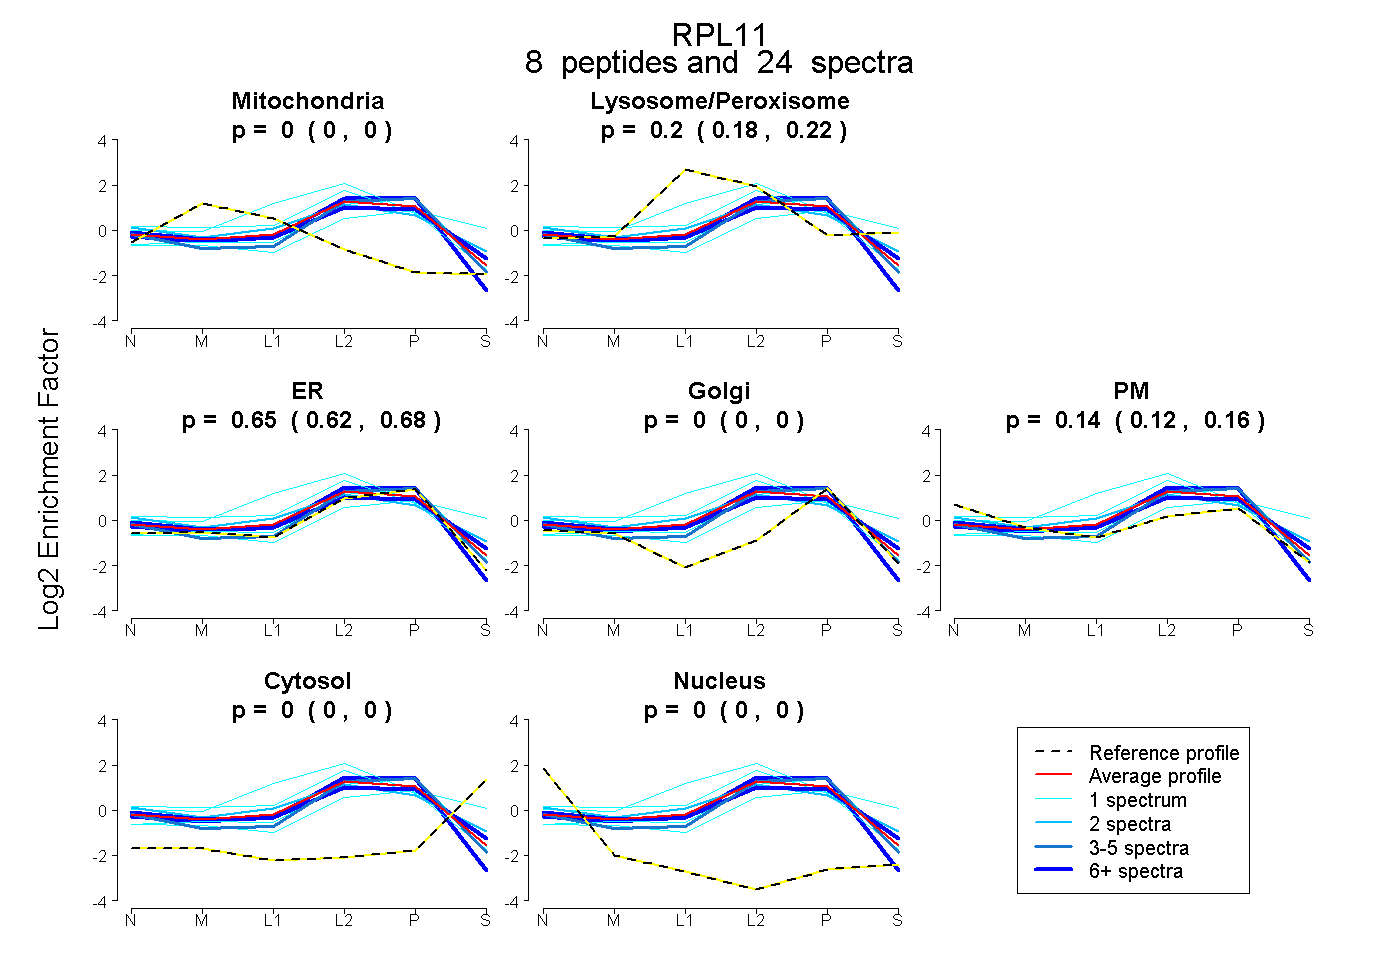 |
0.000 0.000 | 0.000 |
0.204 0.180 | 0.222 |
0.654 0.624 | 0.681 |
0.000 0.000 | 0.000 |
0.142 0.116 | 0.164 |
0.000 0.000 | 0.000 |
0.000 0.000 | 0.000 |
|||
| Plot | Lyso | Other | |||||||||||
| Expt C |
6 peptides |
87 spectra |
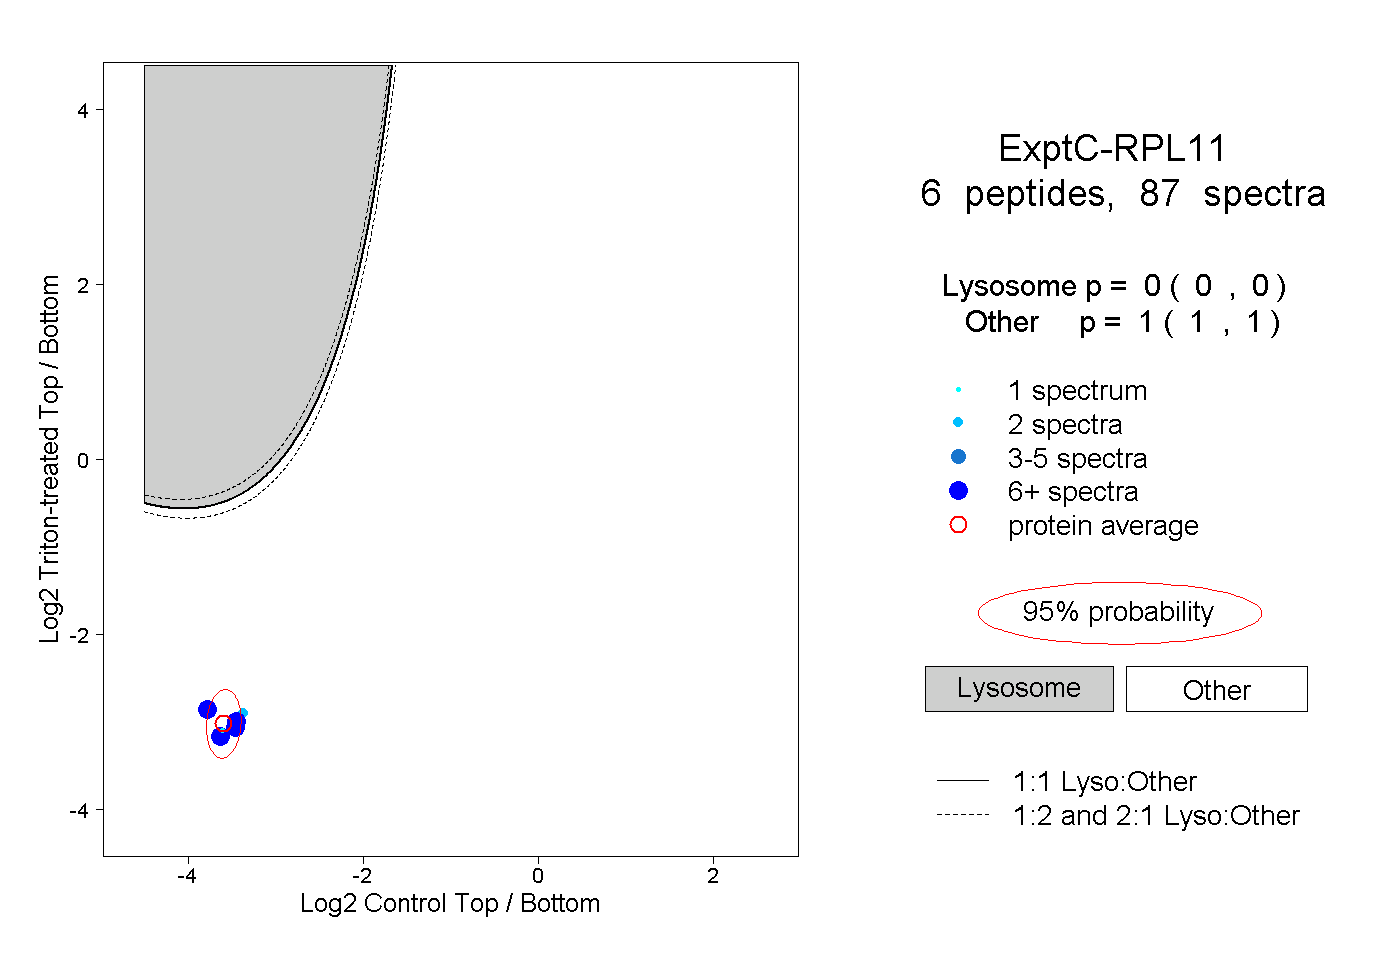 |
0.000 0.000 | 0.000 |
1.000 1.000 | 1.000 |
||||||||
| Plot | Lyso | Other | |||||||||||
| Expt D |
2 peptides |
8 spectra |
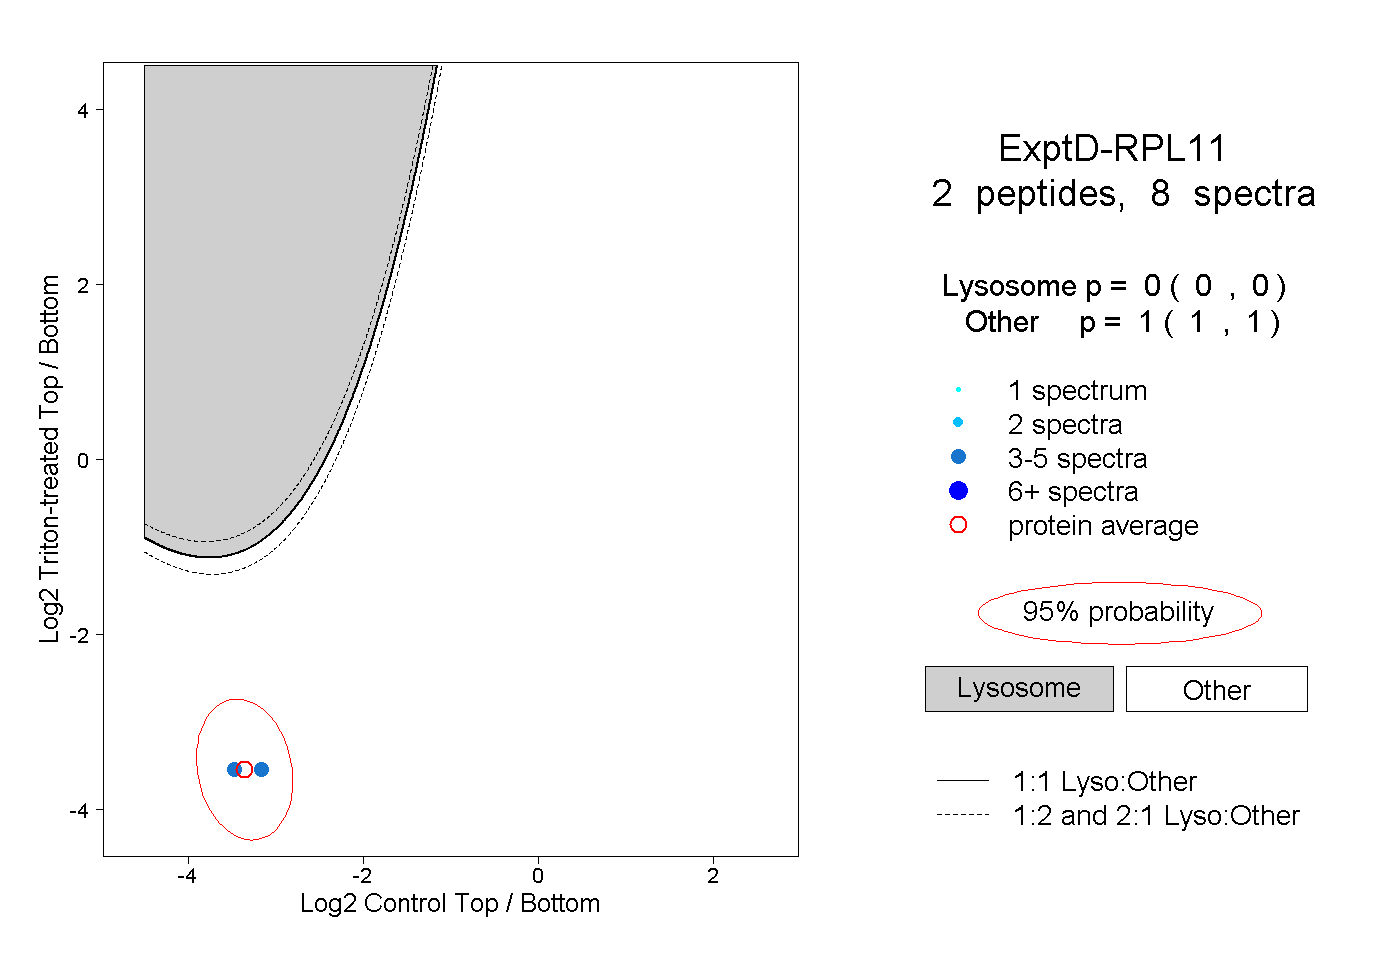 |
0.000 0.000 | 0.000 |
1.000 1.000 | 1.000 |