 7
7peptides
spectra
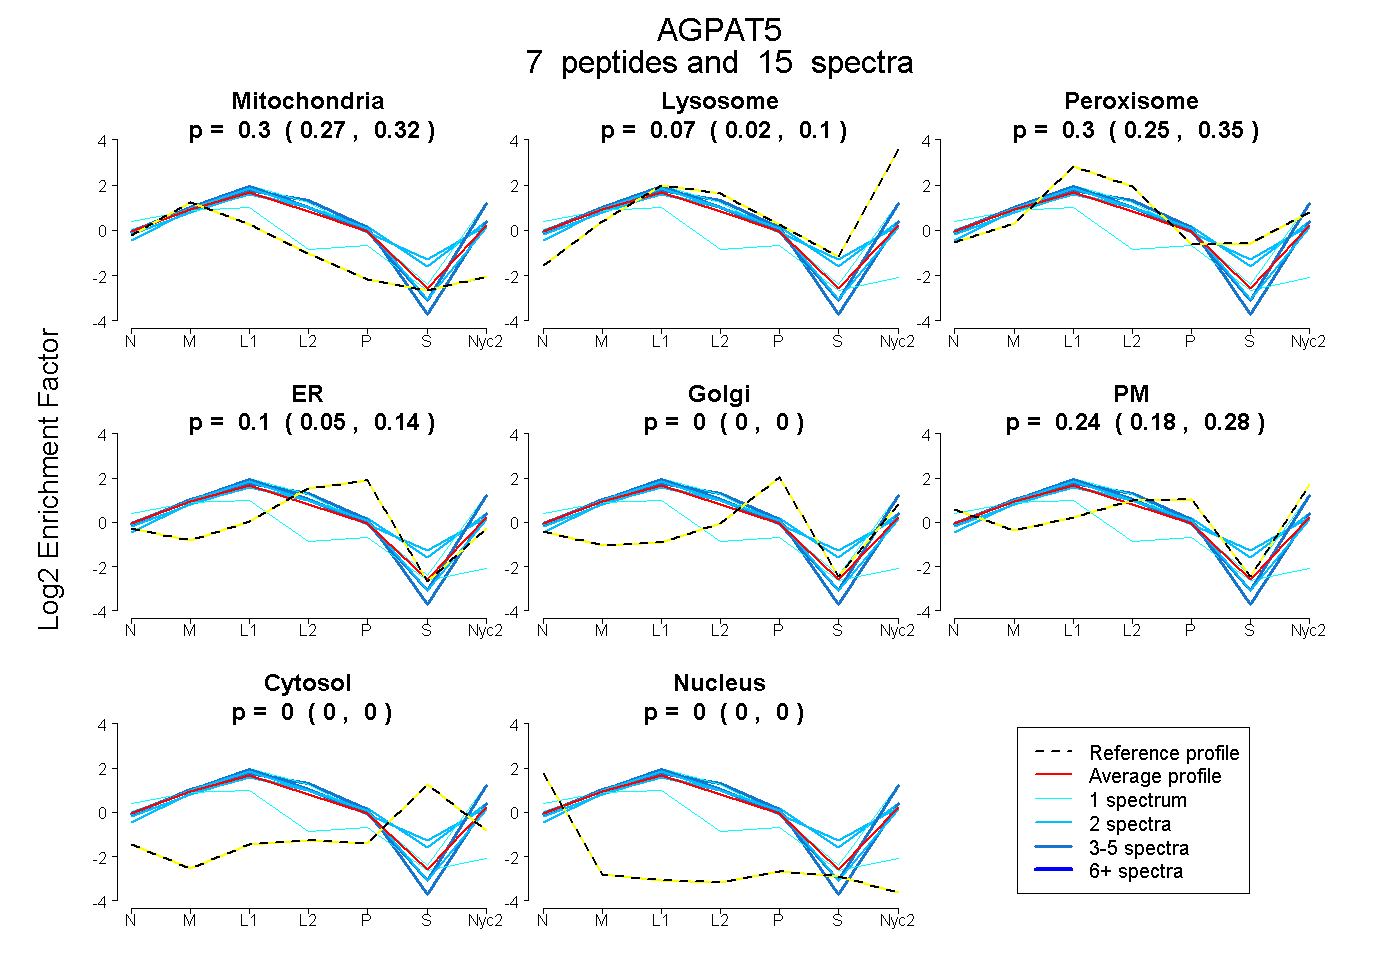
0.275 | 0.319
0.023 | 0.103
0.247 | 0.345
0.045 | 0.143
0.000 | 0.000
0.181 | 0.283
0.000 | 0.000
0.000 | 0.000
4peptides
spectra
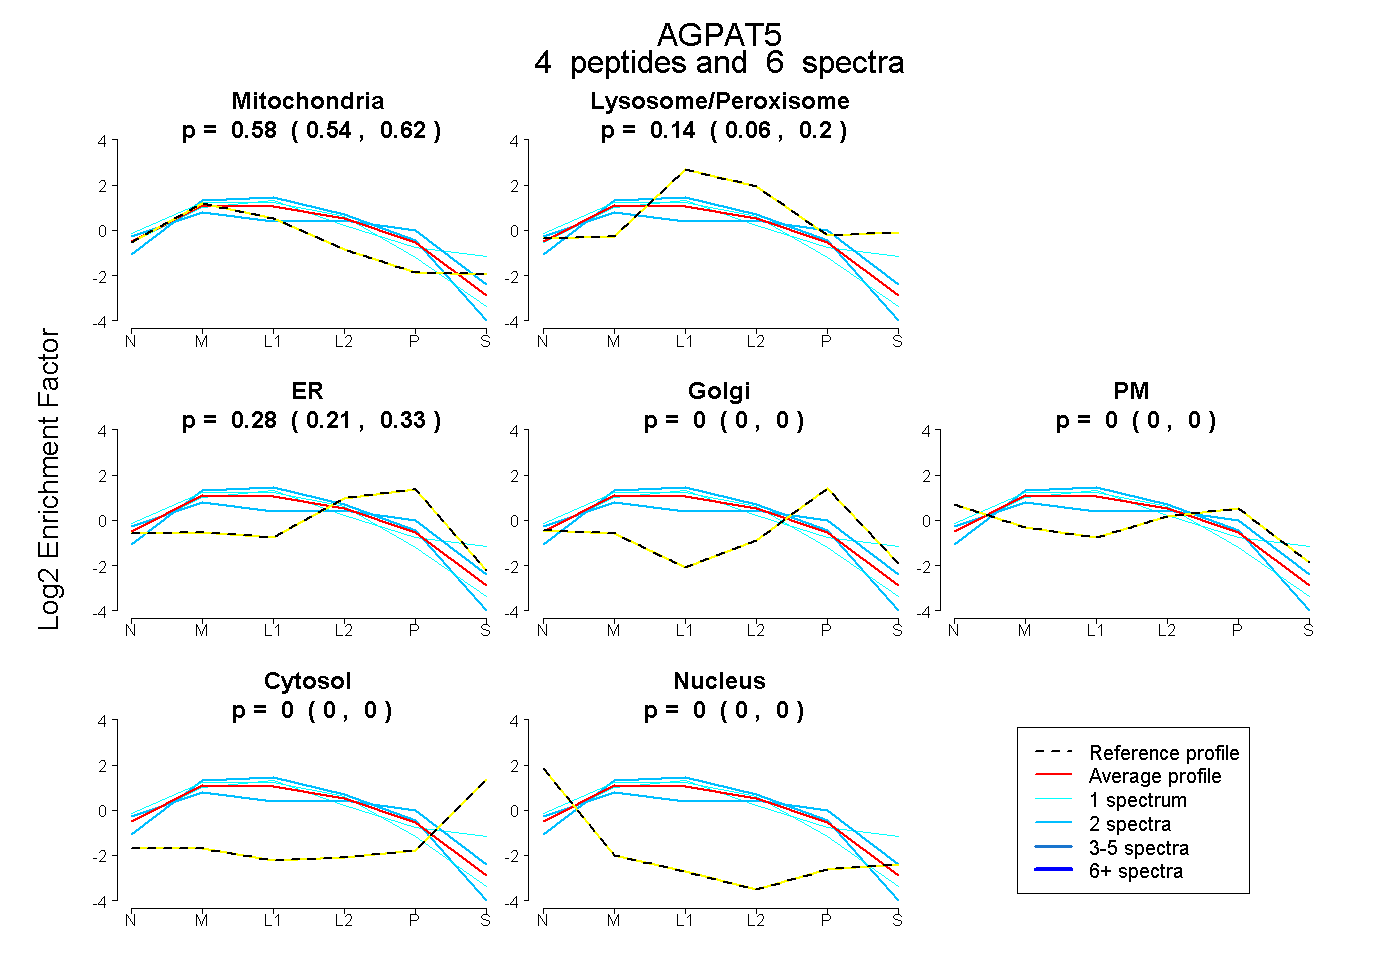
0.536 | 0.618
0.061 | 0.199
0.215 | 0.334
0.000 | 0.000
0.000 | 0.000
0.000 | 0.000
0.000 | 0.000
9peptides
spectra
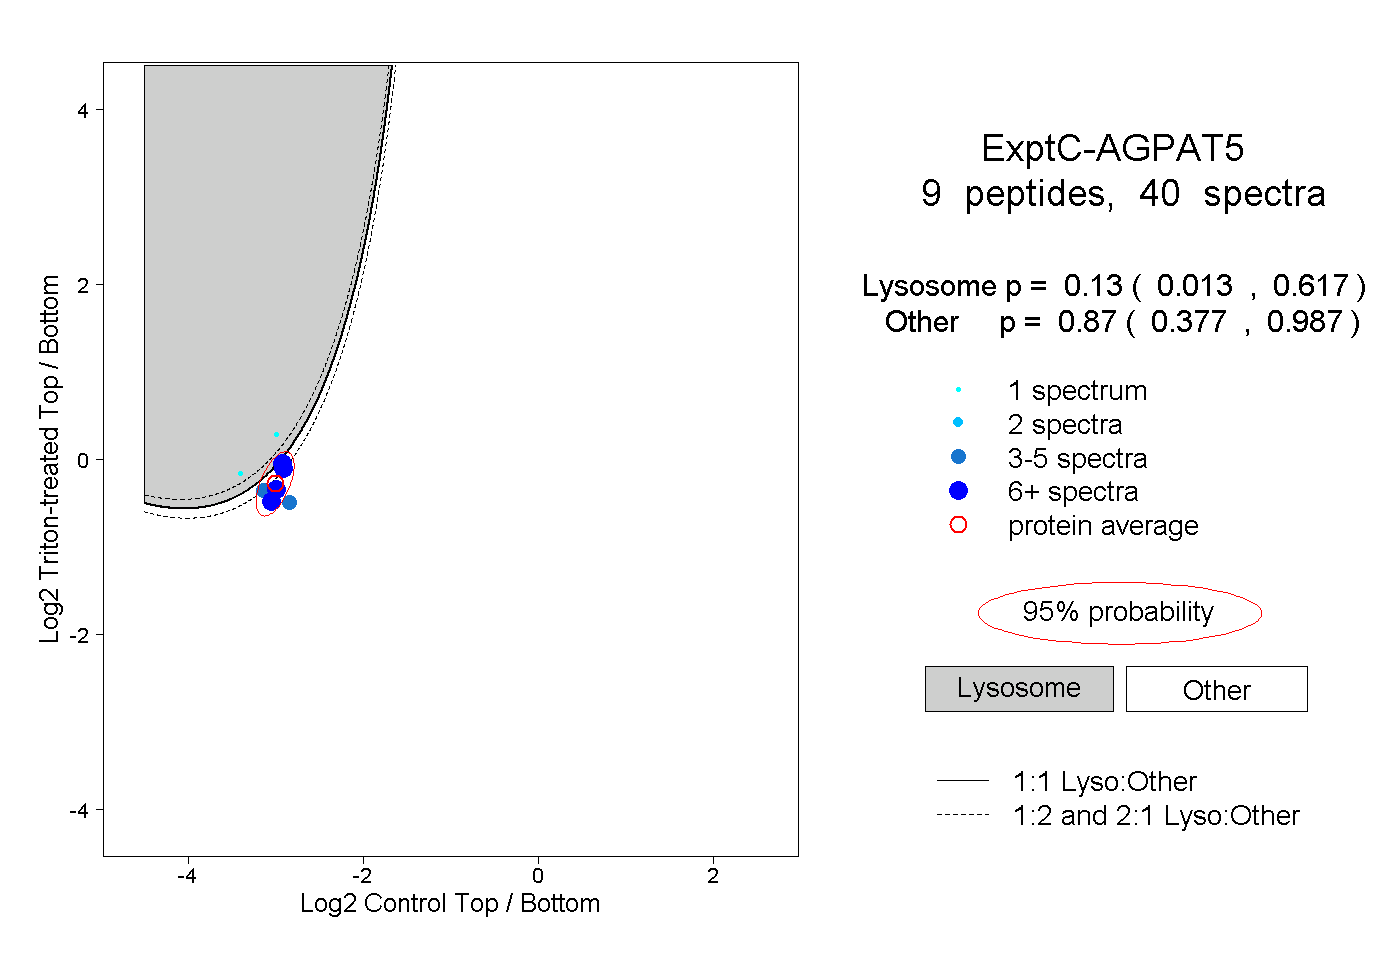
0.013 | 0.617
0.377 | 0.987
2peptides
spectra
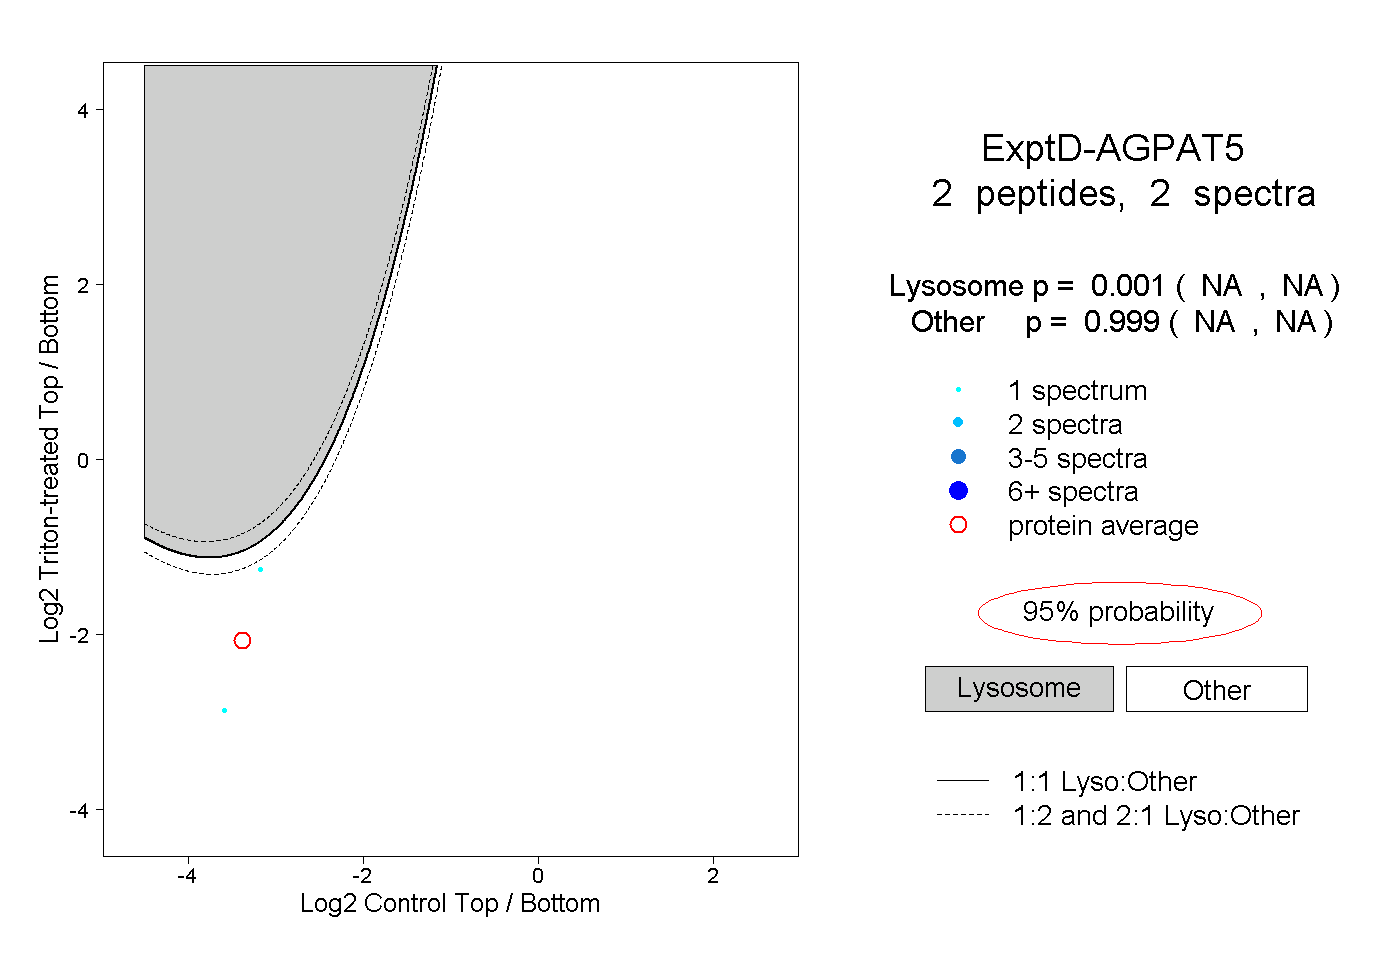
NA | NA
NA | NA