 3
3peptides
spectra
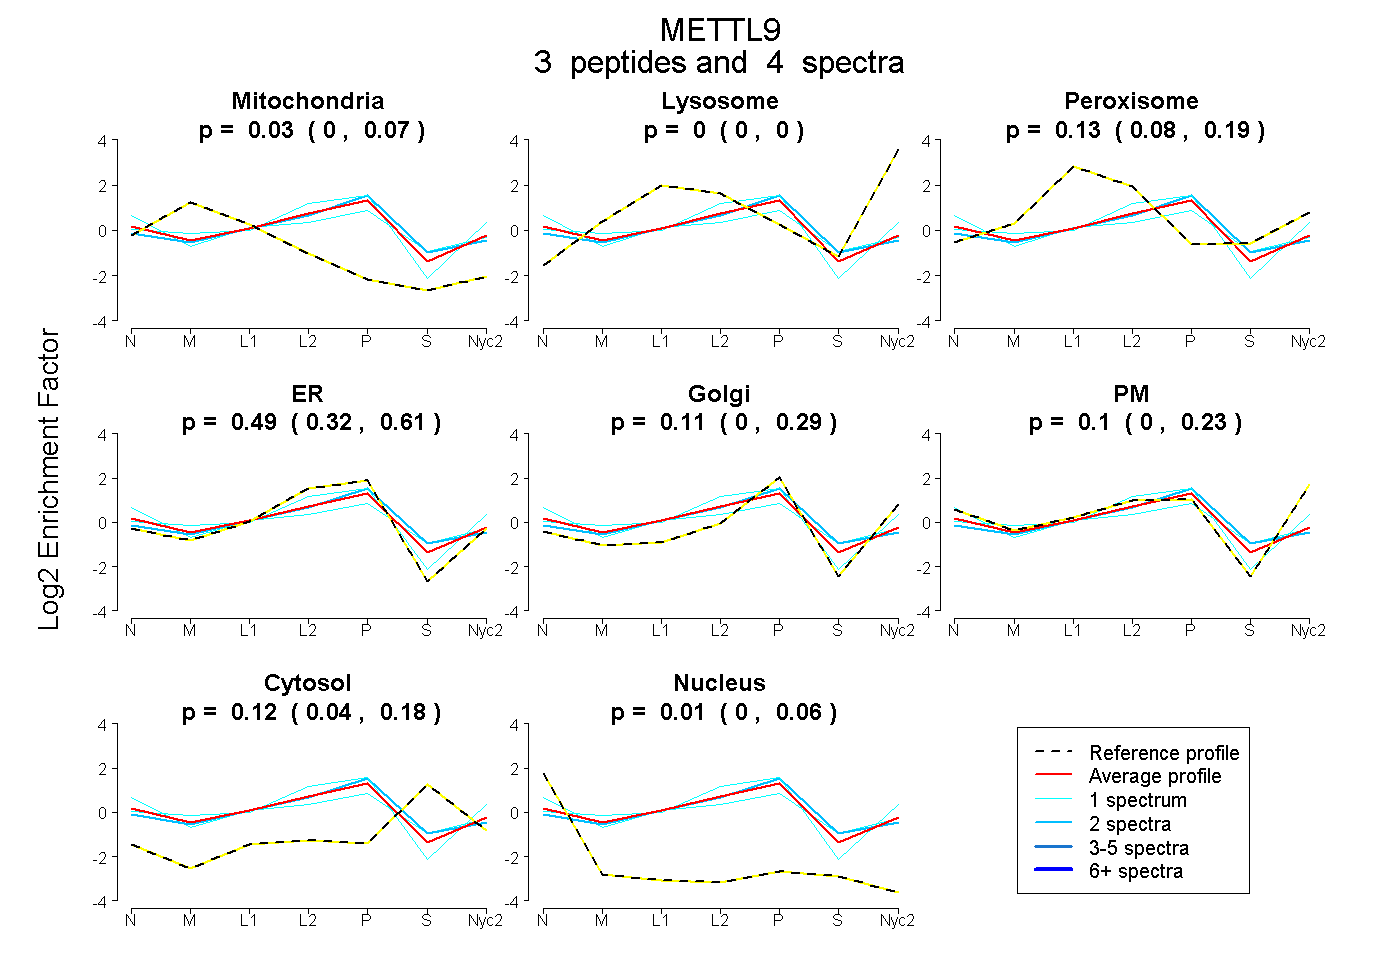
0.000 | 0.073
0.000 | 0.000
0.076 | 0.189
0.325 | 0.611
0.000 | 0.287
0.000 | 0.232
0.037 | 0.175
0.000 | 0.059
2peptides
spectra
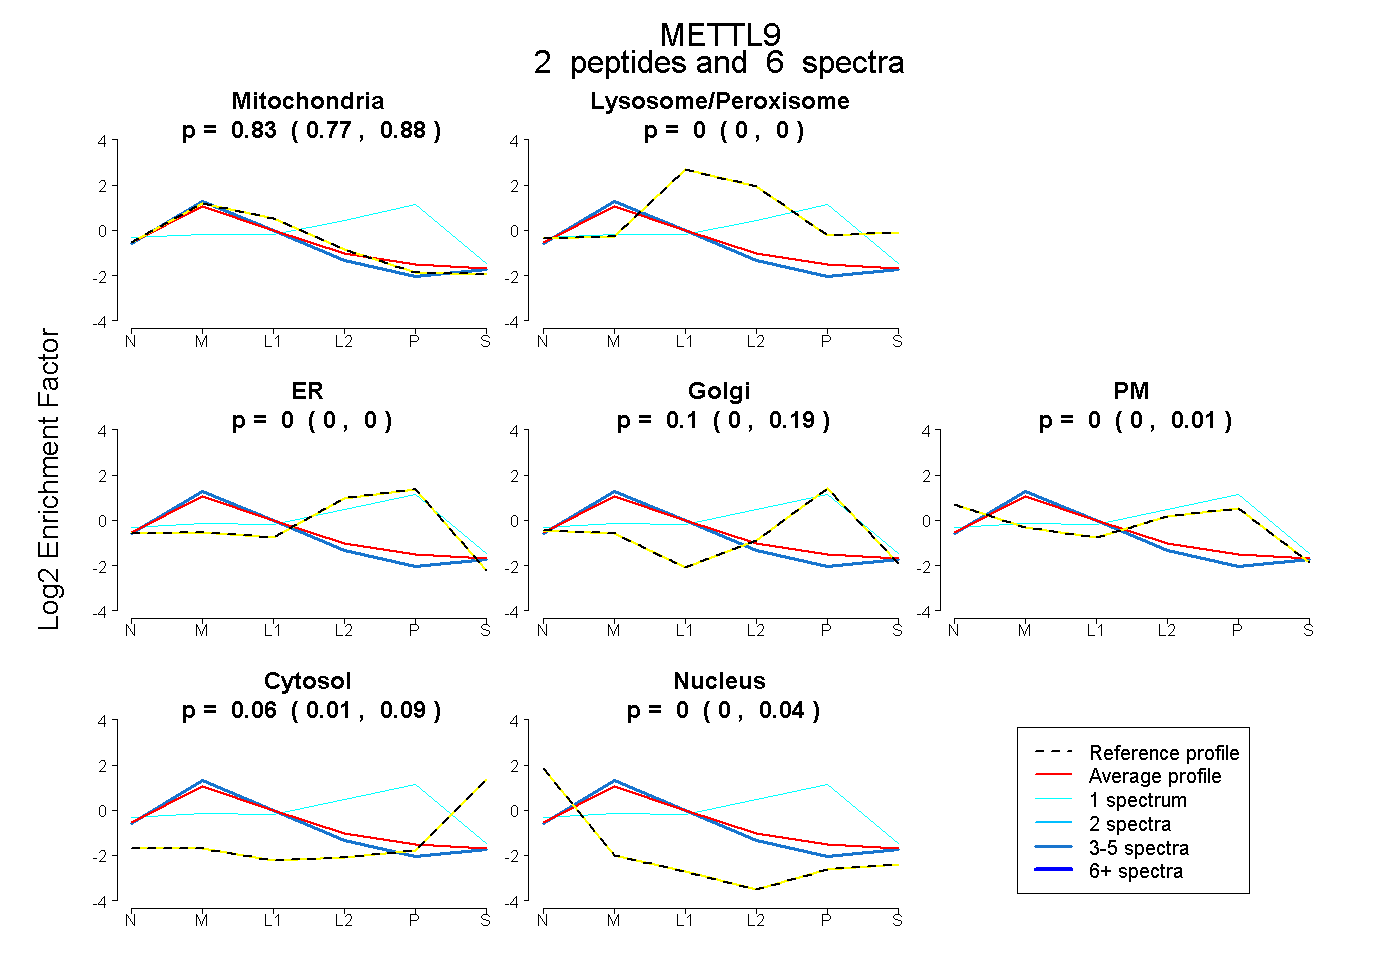
0.765 | 0.878
0.000 | 0.000
0.000 | 0.000
0.000 | 0.191
0.000 | 0.009
0.010 | 0.086
0.000 | 0.043
3peptides
spectra
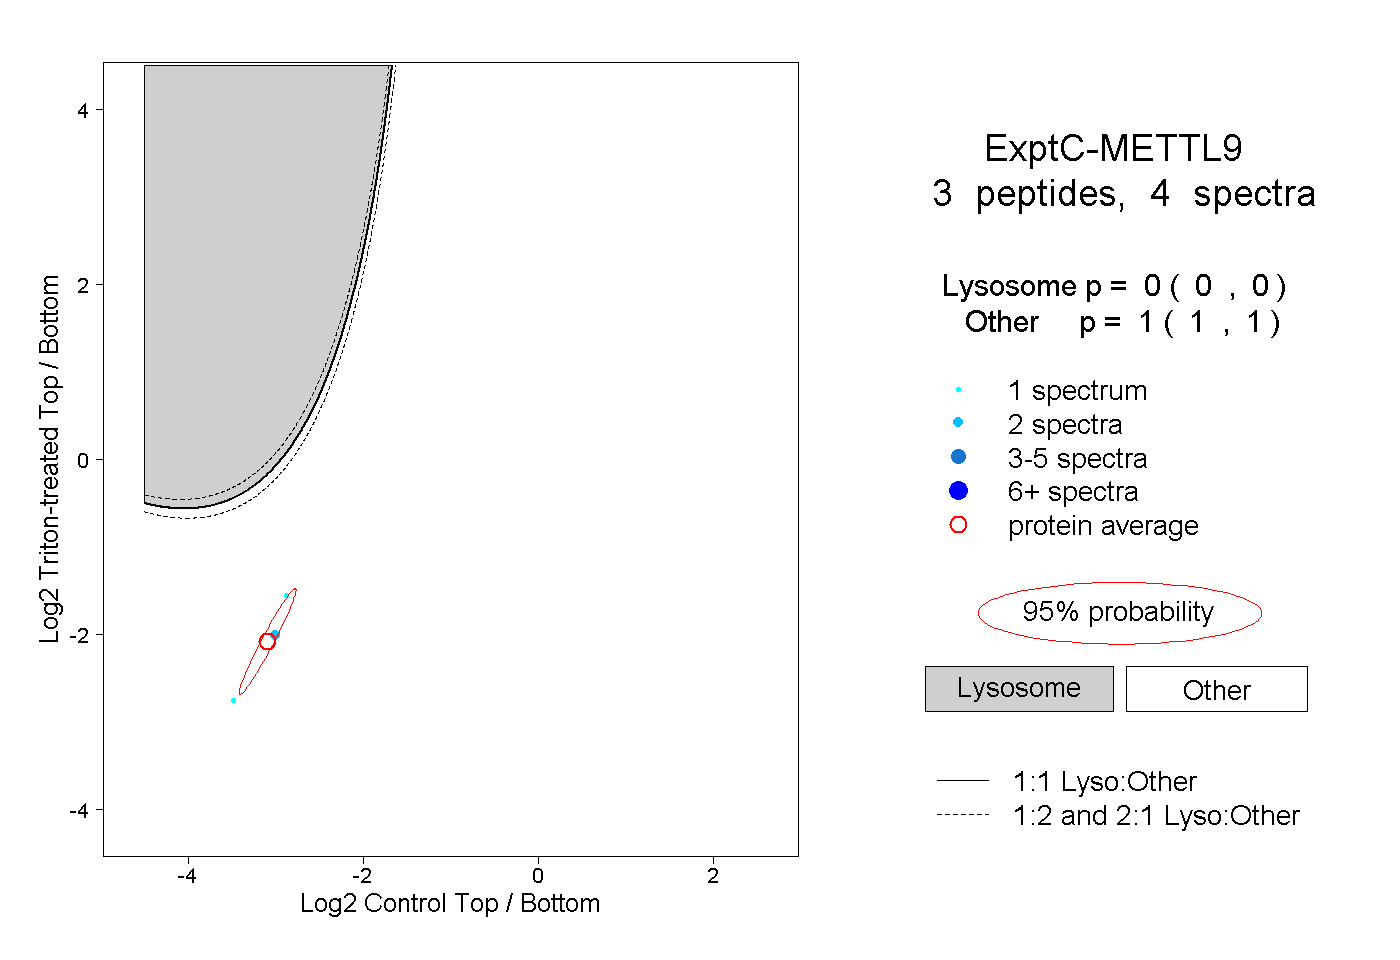
0.000 | 0.000
1.000 | 1.000
1peptide
spectrum
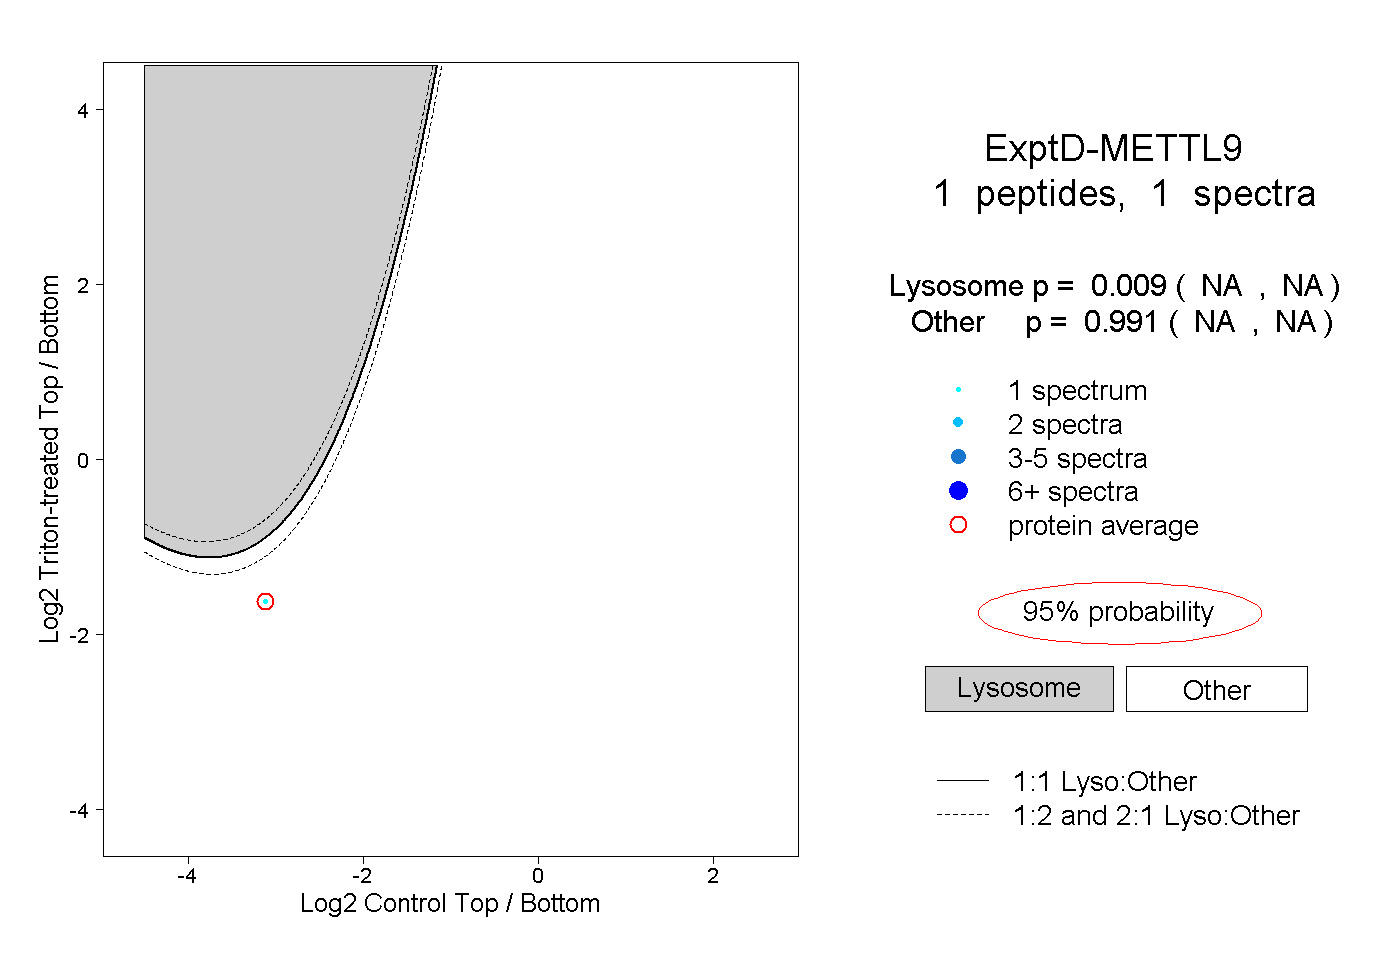
NA | NA
NA | NA