12
12peptides
spectra
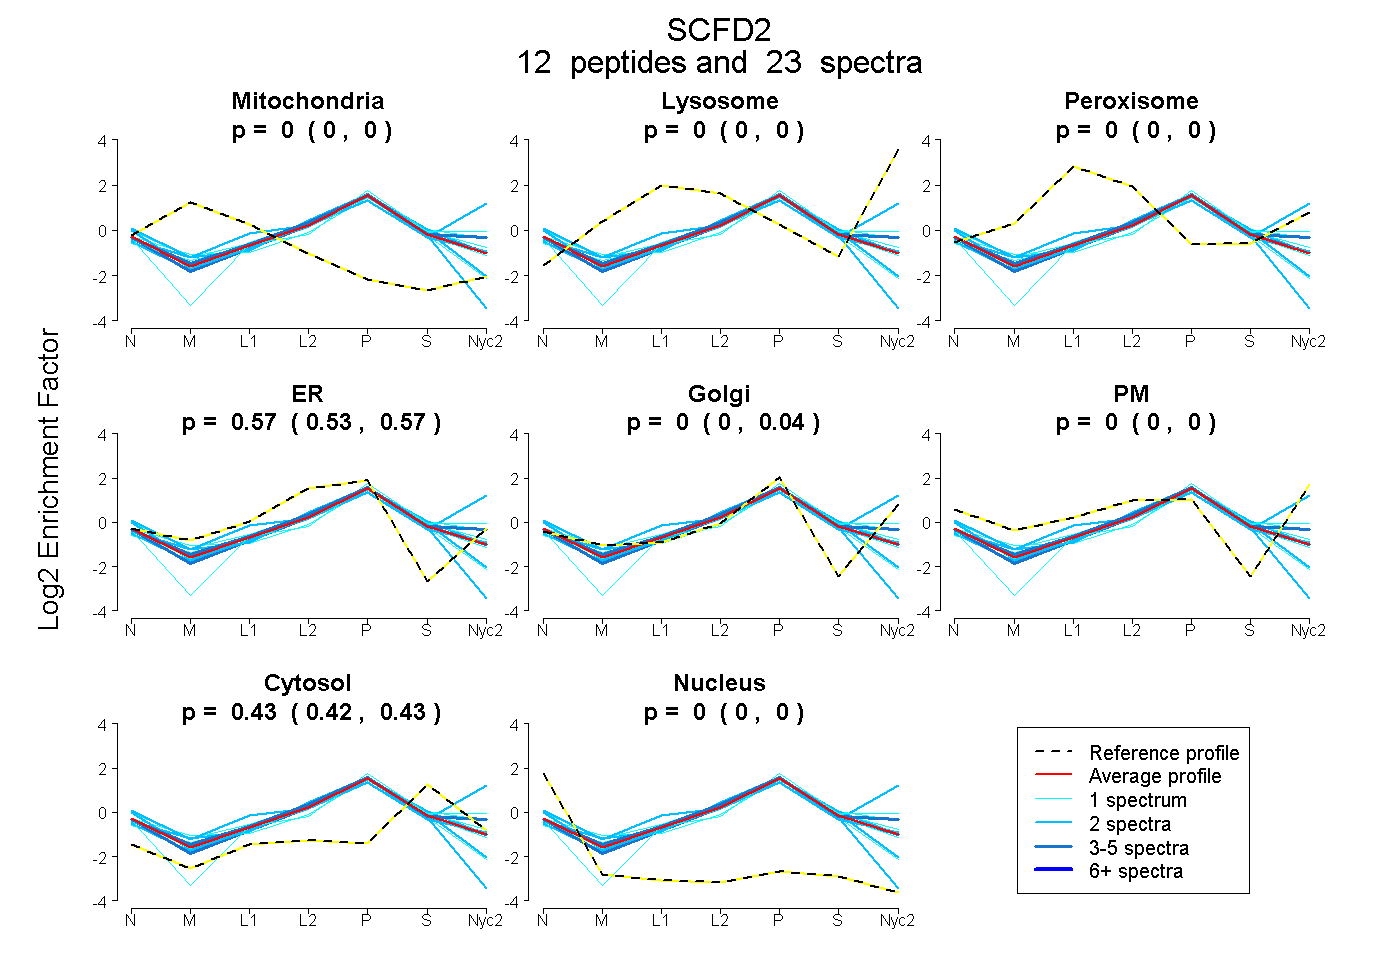
0.000 | 0.000
0.000 | 0.000
0.000 | 0.000
0.532 | 0.572
0.000 | 0.037
0.000 | 0.000
0.420 | 0.433
0.000 | 0.000
6peptides
spectra
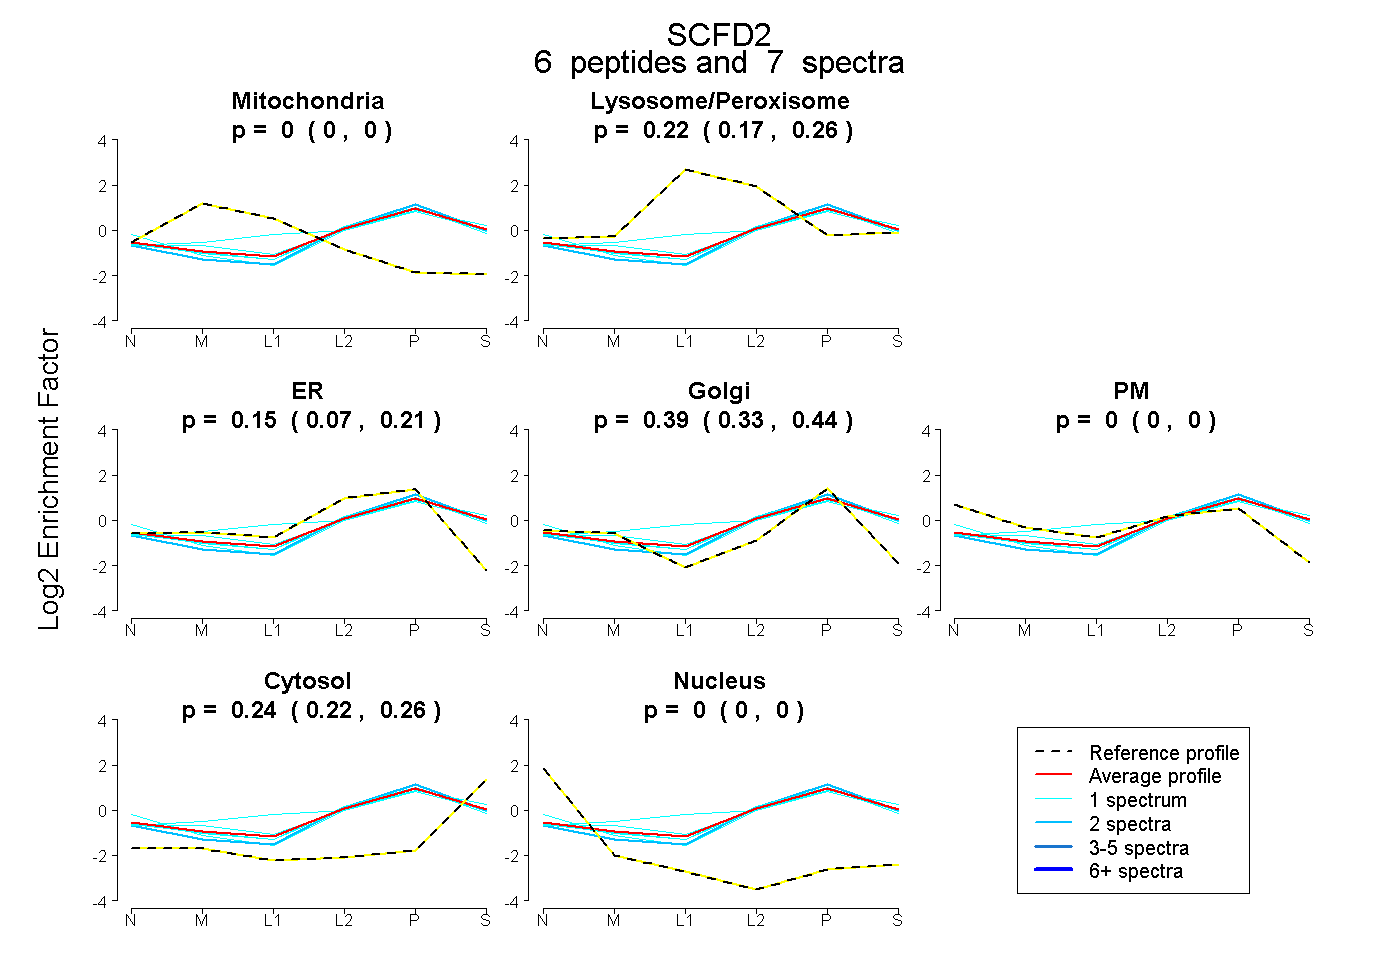
0.000 | 0.000
0.173 | 0.255
0.070 | 0.212
0.332 | 0.441
0.000 | 0.000
0.215 | 0.263
0.000 | 0.000
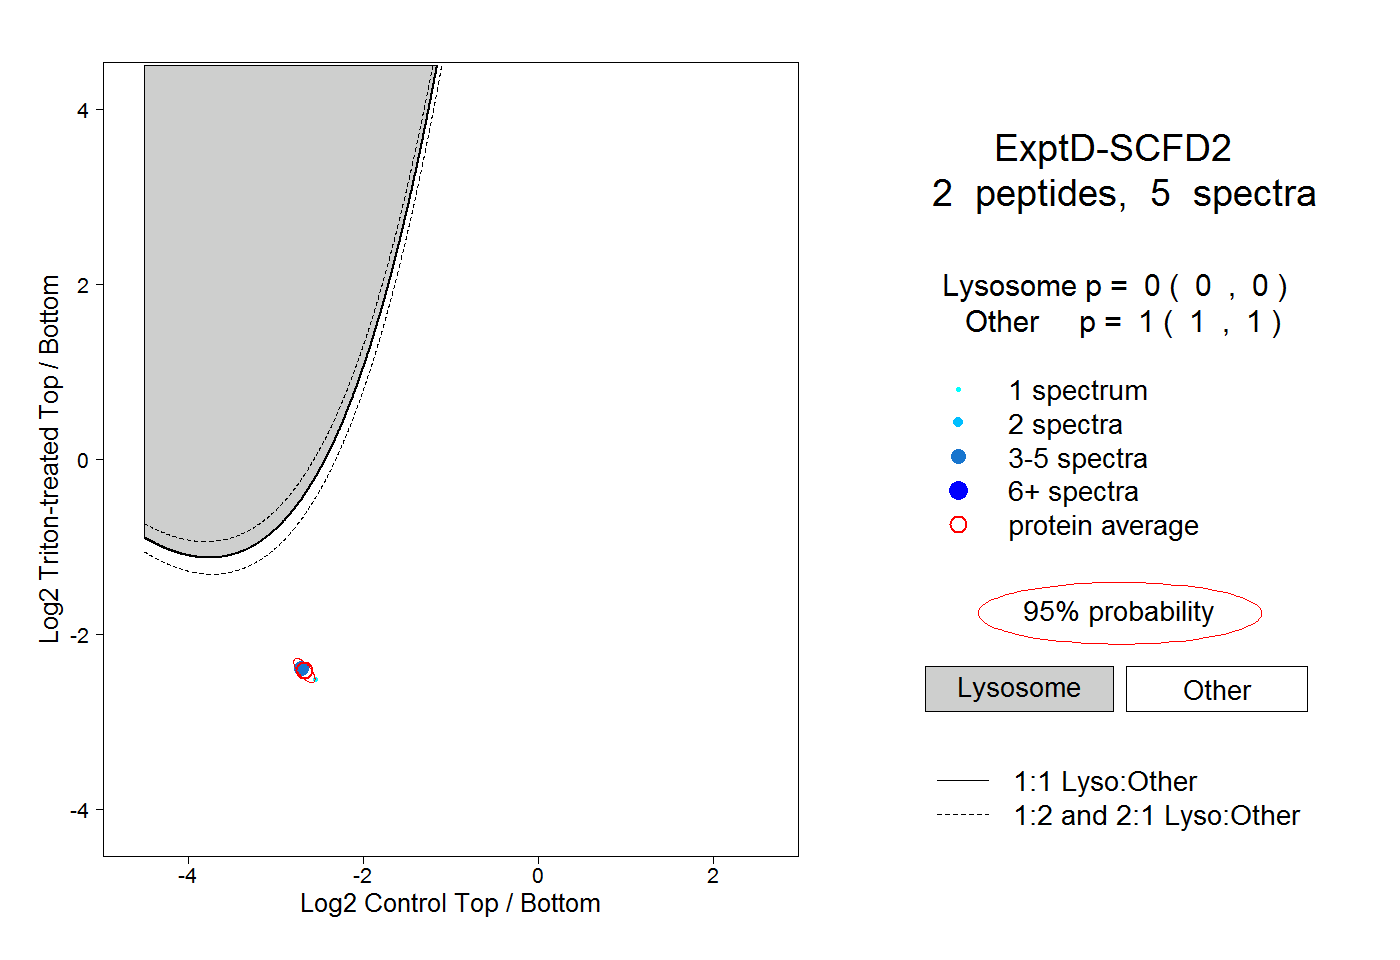
13peptides
spectra
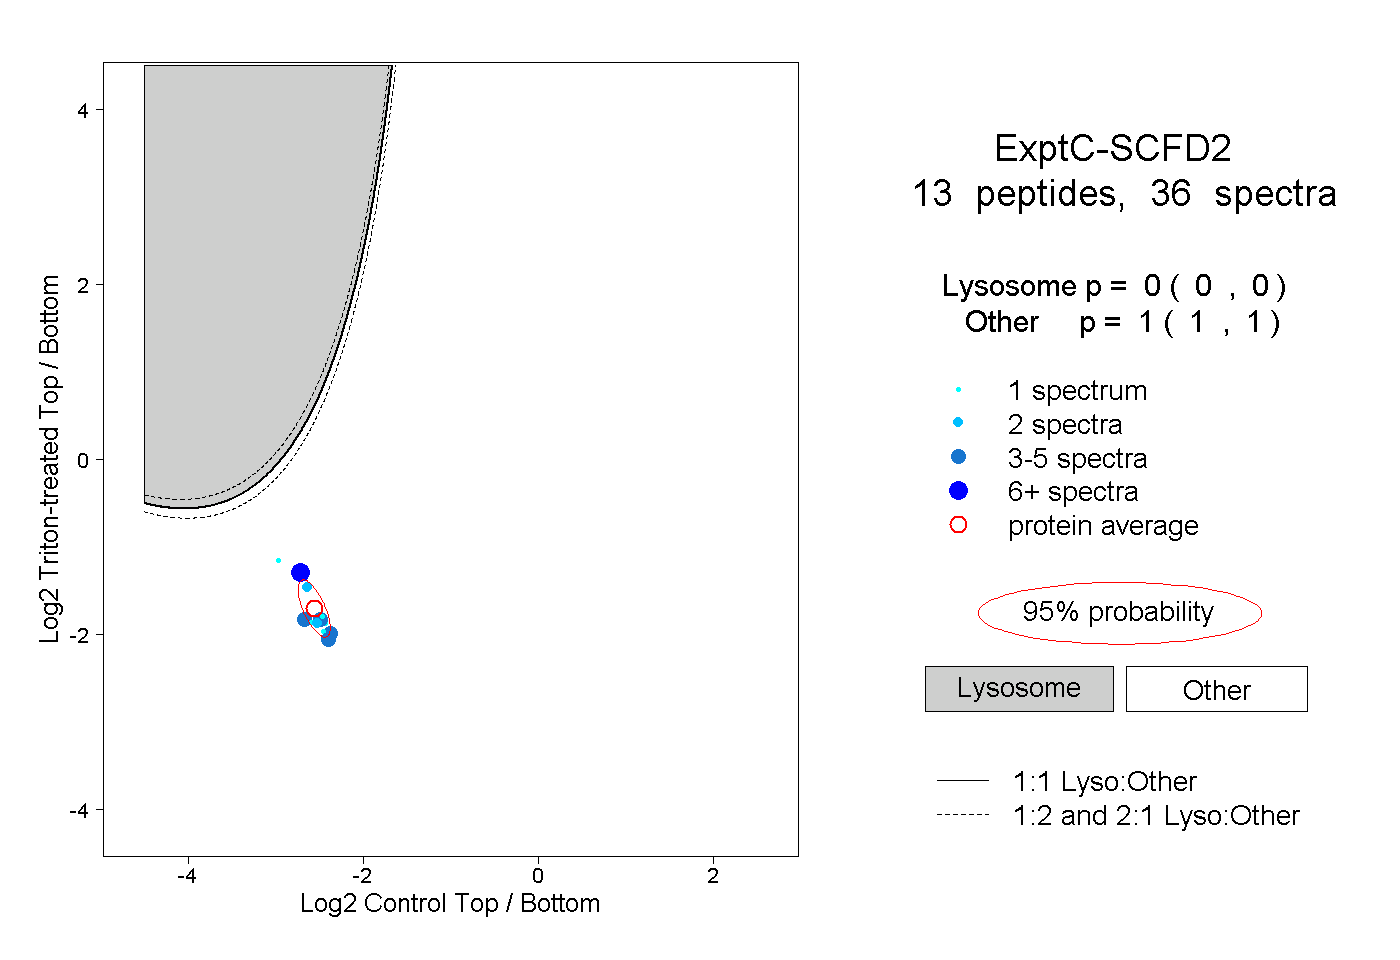
0.000 | 0.000
1.000 | 1.000