 12
12peptides
spectra
0.000 | 0.000
0.000 | 0.000
0.000 | 0.000
0.532 | 0.572
0.000 | 0.037
0.000 | 0.000
0.420 | 0.433
0.000 | 0.000
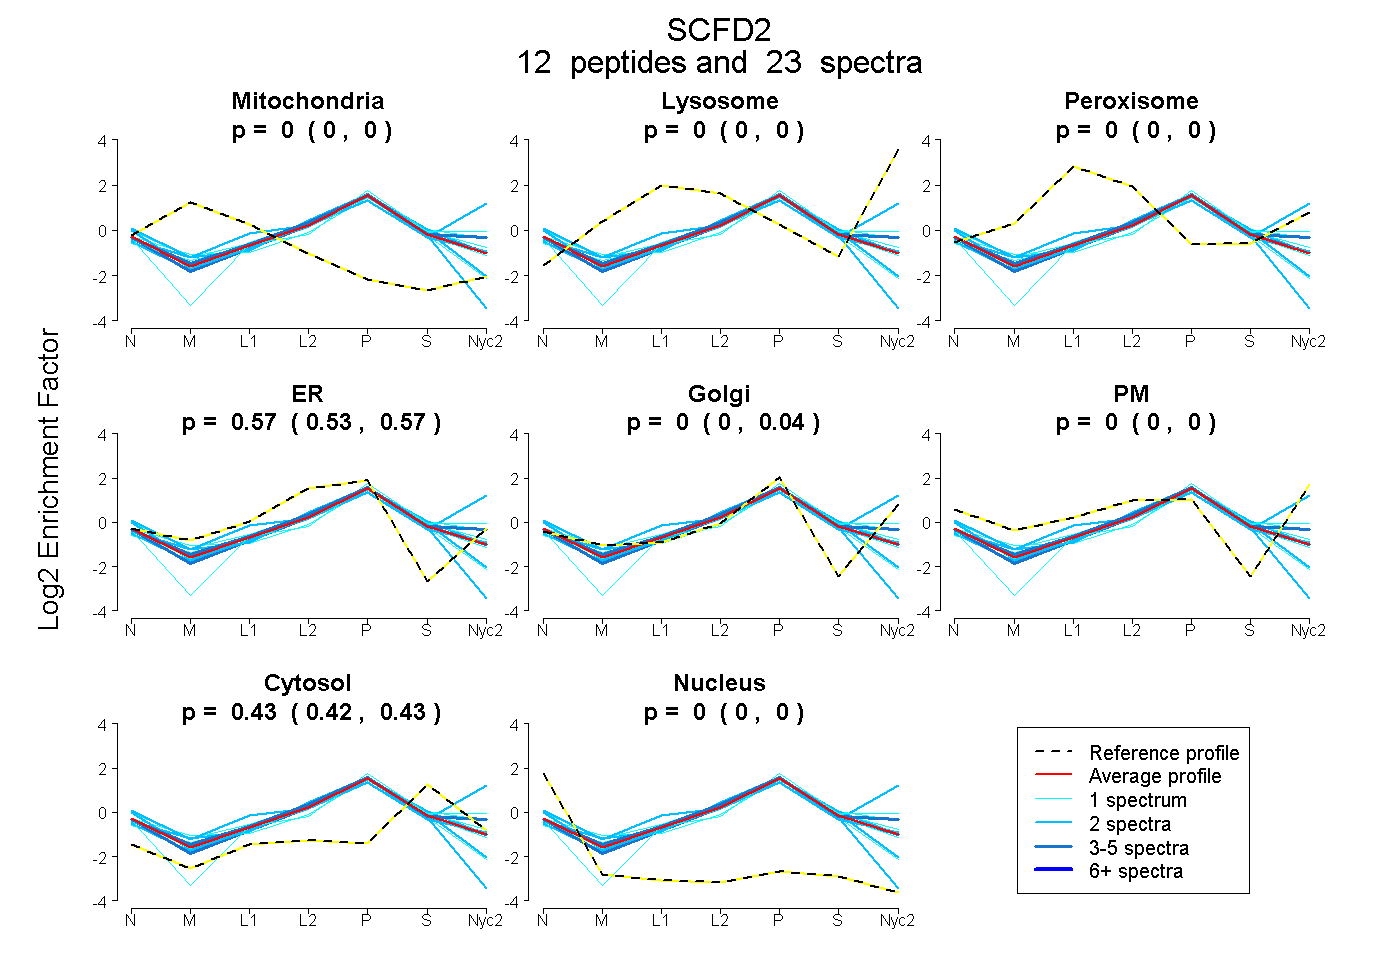
| Plot | Mito | Lyso | Perox | ER | Golgi | PM | Cytosol | Nucleus | |||||
| Expt A |
12 peptides |
23 spectra |
|
0.000 0.000 | 0.000 |
0.000 0.000 | 0.000 |
0.000 0.000 | 0.000 |
0.571 0.532 | 0.572 |
0.000 0.000 | 0.037 |
0.000 0.000 | 0.000 |
0.429 0.420 | 0.433 |
0.000 0.000 | 0.000 |
| 3 spectra, SQTAVNDVFTALR | 0.000 | 0.000 | 0.000 | 0.459 | 0.164 | 0.000 | 0.377 | 0.000 | ||
| 1 spectrum, LLKPLNIPELLFATDR | 0.000 | 0.000 | 0.000 | 0.305 | 0.210 | 0.000 | 0.485 | 0.000 | ||
| 2 spectra, IVDTLQDIICR | 0.000 | 0.000 | 0.000 | 0.550 | 0.000 | 0.000 | 0.326 | 0.123 | ||
| 1 spectrum, ASVVFVDR | 0.000 | 0.000 | 0.000 | 0.563 | 0.000 | 0.000 | 0.364 | 0.073 | ||
| 2 spectra, ALWEALLNTK | 0.000 | 0.000 | 0.000 | 0.543 | 0.000 | 0.000 | 0.457 | 0.000 | ||
| 1 spectrum, ALTNHCGLLQLGMATVQTLK | 0.000 | 0.000 | 0.000 | 0.366 | 0.215 | 0.000 | 0.419 | 0.000 | ||
| 2 spectra, HPQTAK | 0.000 | 0.116 | 0.000 | 0.000 | 0.248 | 0.362 | 0.274 | 0.000 | ||
| 1 spectrum, LLEAVK | 0.000 | 0.000 | 0.046 | 0.333 | 0.252 | 0.000 | 0.370 | 0.000 | ||
| 1 spectrum, EAVMEVR | 0.000 | 0.000 | 0.000 | 0.456 | 0.119 | 0.000 | 0.421 | 0.004 | ||
| 2 spectra, EECFAVGSLSR | 0.000 | 0.000 | 0.000 | 0.535 | 0.000 | 0.000 | 0.440 | 0.025 | ||
| 2 spectra, HLVEAASR | 0.000 | 0.000 | 0.000 | 0.541 | 0.058 | 0.000 | 0.400 | 0.001 | ||
| 5 spectra, DTDLGDVEEK | 0.000 | 0.000 | 0.000 | 0.526 | 0.042 | 0.000 | 0.432 | 0.000 |
| Plot | Mito | Lyso or Perox | ER | Golgi | PM | Cytosol | Nucleus | ||||||
| Expt B |
6 peptides |
7 spectra |
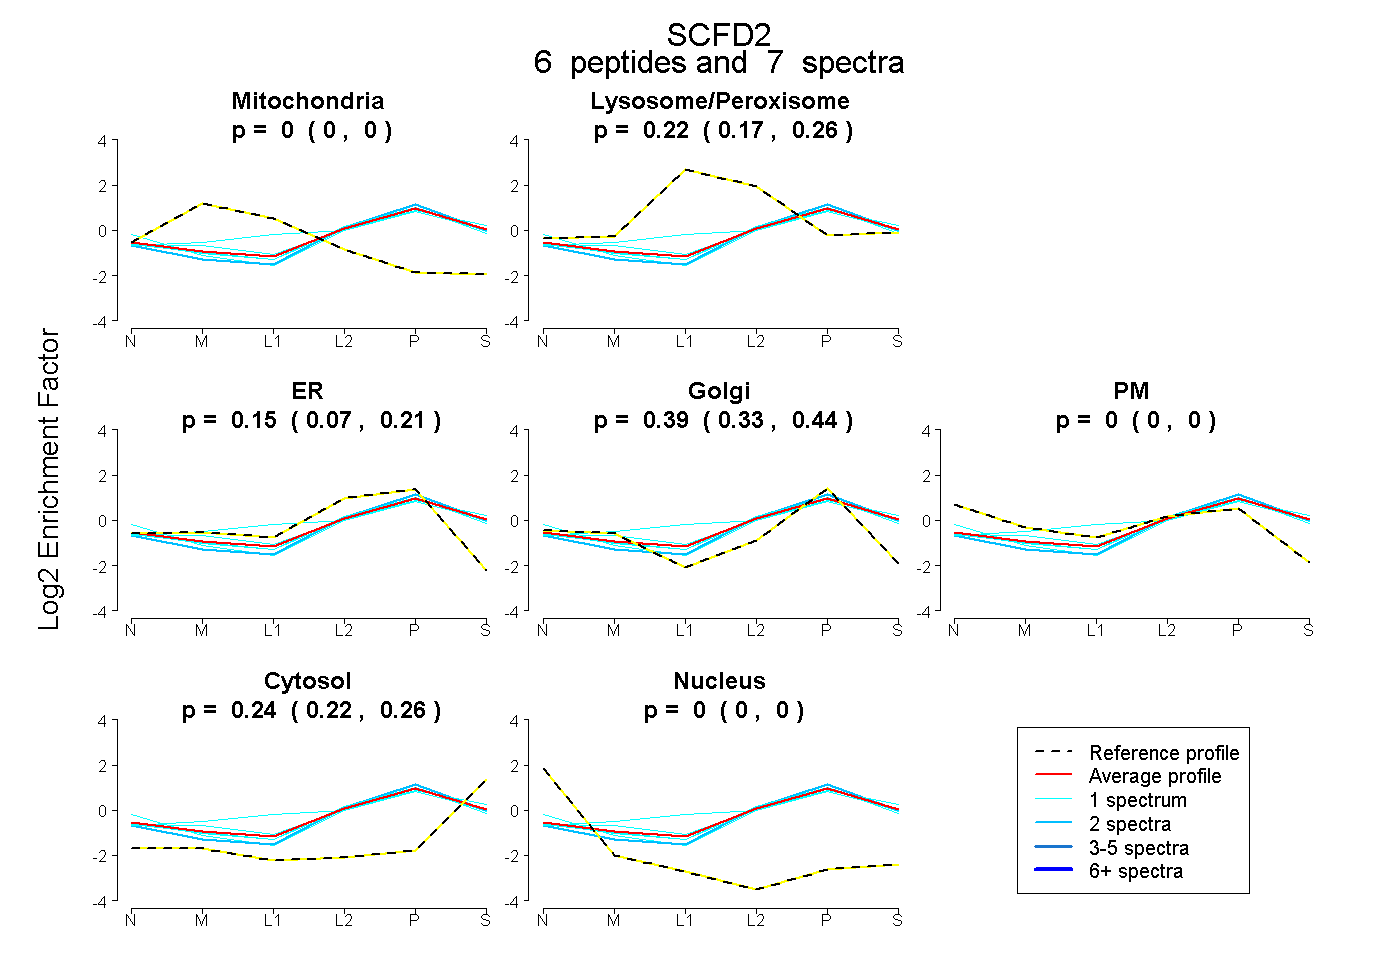 |
0.000 0.000 | 0.000 |
0.216 0.173 | 0.255 |
0.151 0.070 | 0.212 |
0.391 0.332 | 0.441 |
0.000 0.000 | 0.000 |
0.241 0.215 | 0.263 |
0.000 0.000 | 0.000 |
|||
| Plot | Lyso | Other | |||||||||||
| Expt C |
13 peptides |
36 spectra |
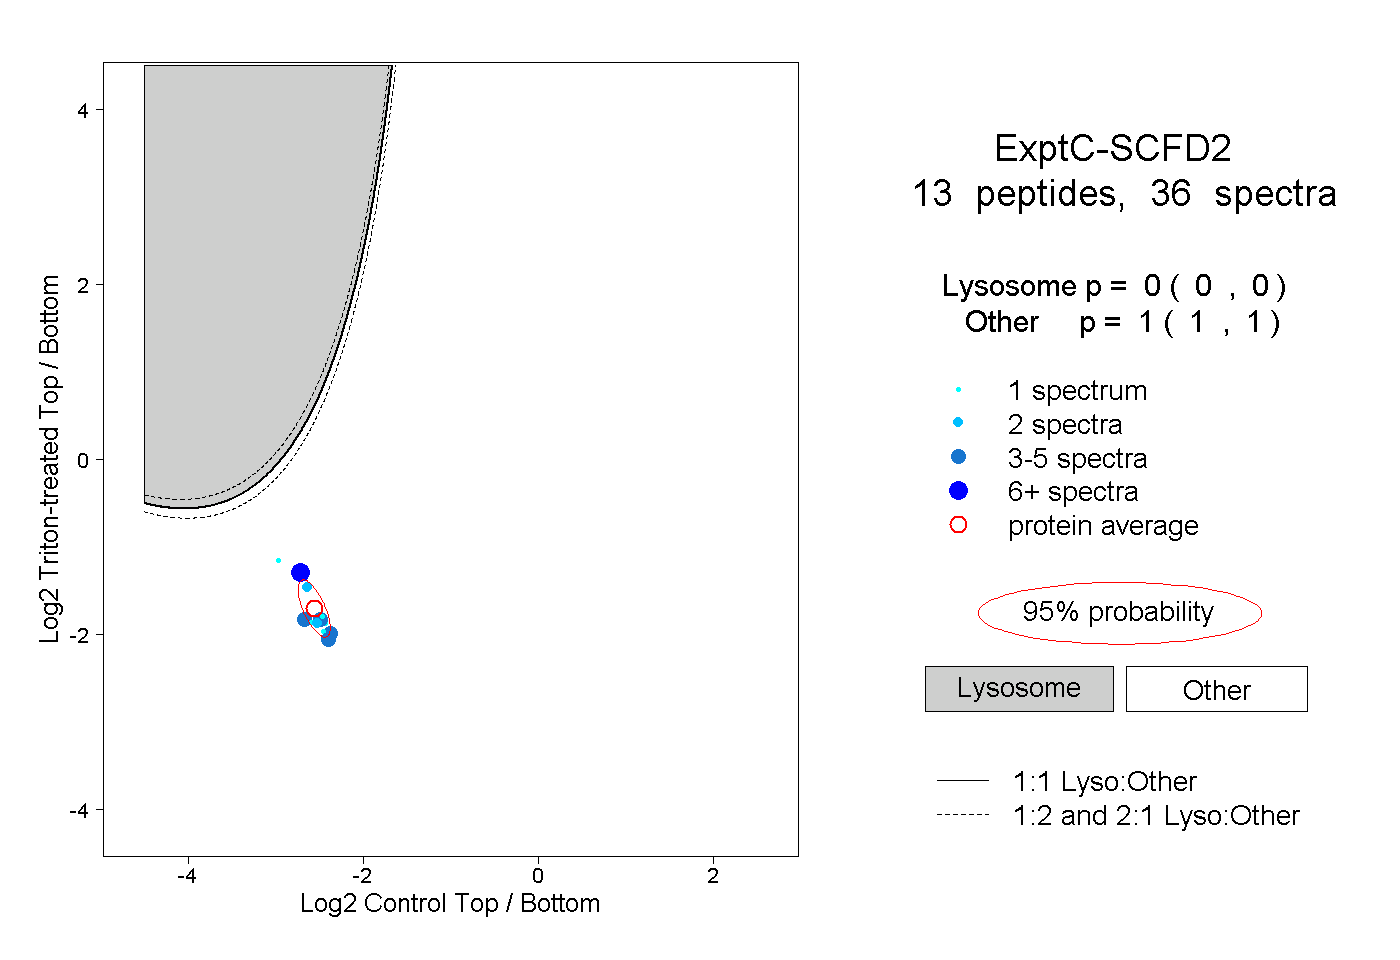 |
0.000 0.000 | 0.000 |
1.000 1.000 | 1.000 |
||||||||
| Plot | Lyso | Other | |||||||||||
| Expt D |
2 peptides |
5 spectra |
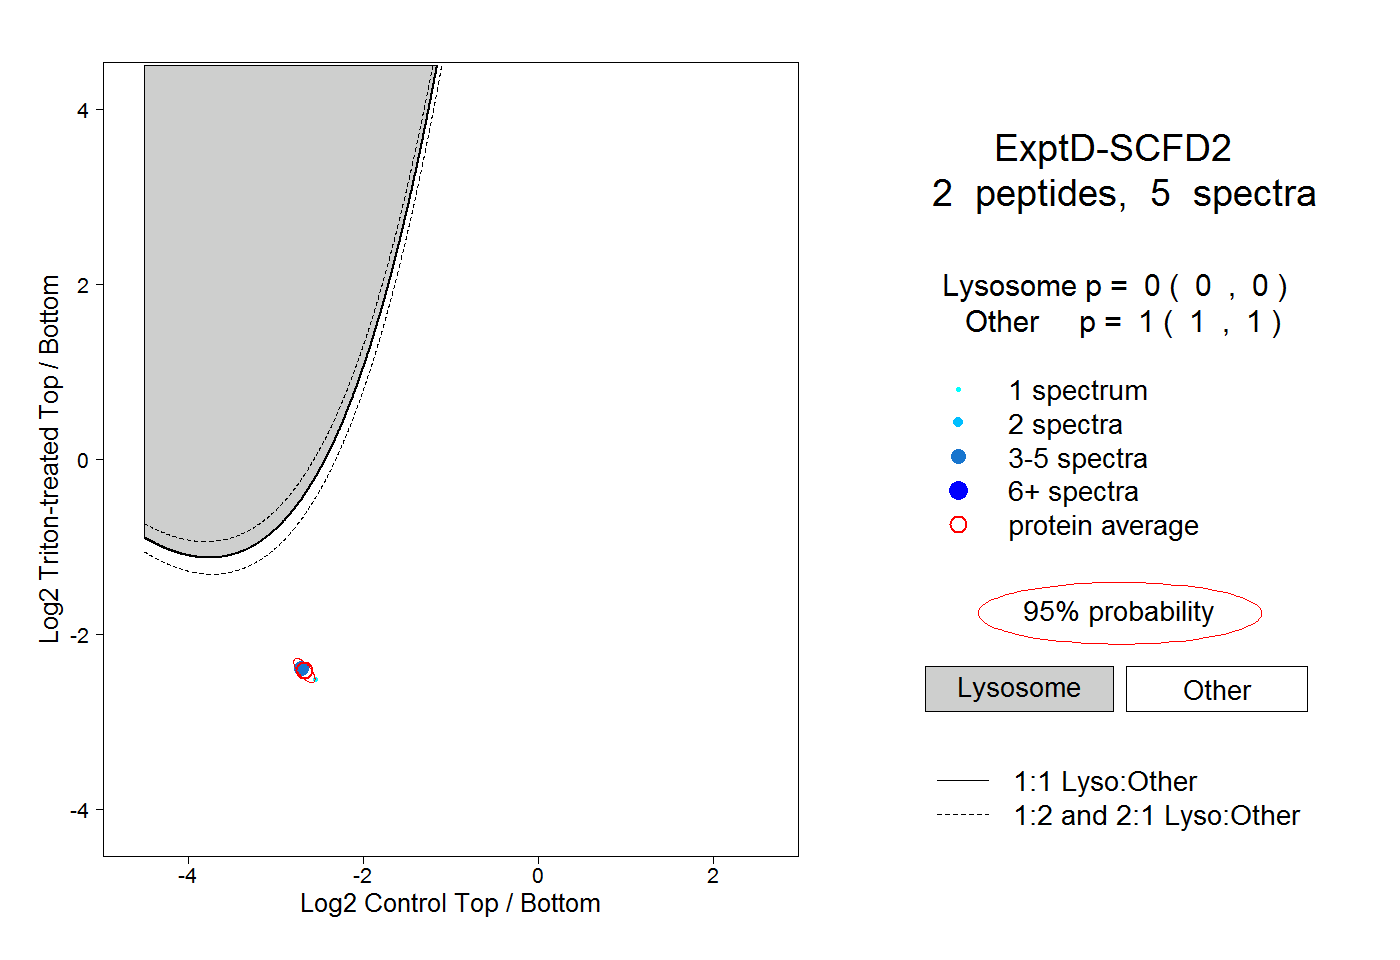 |
0.000 0.000 | 0.000 |
1.000 1.000 | 1.000 |