 3
3peptides
spectra
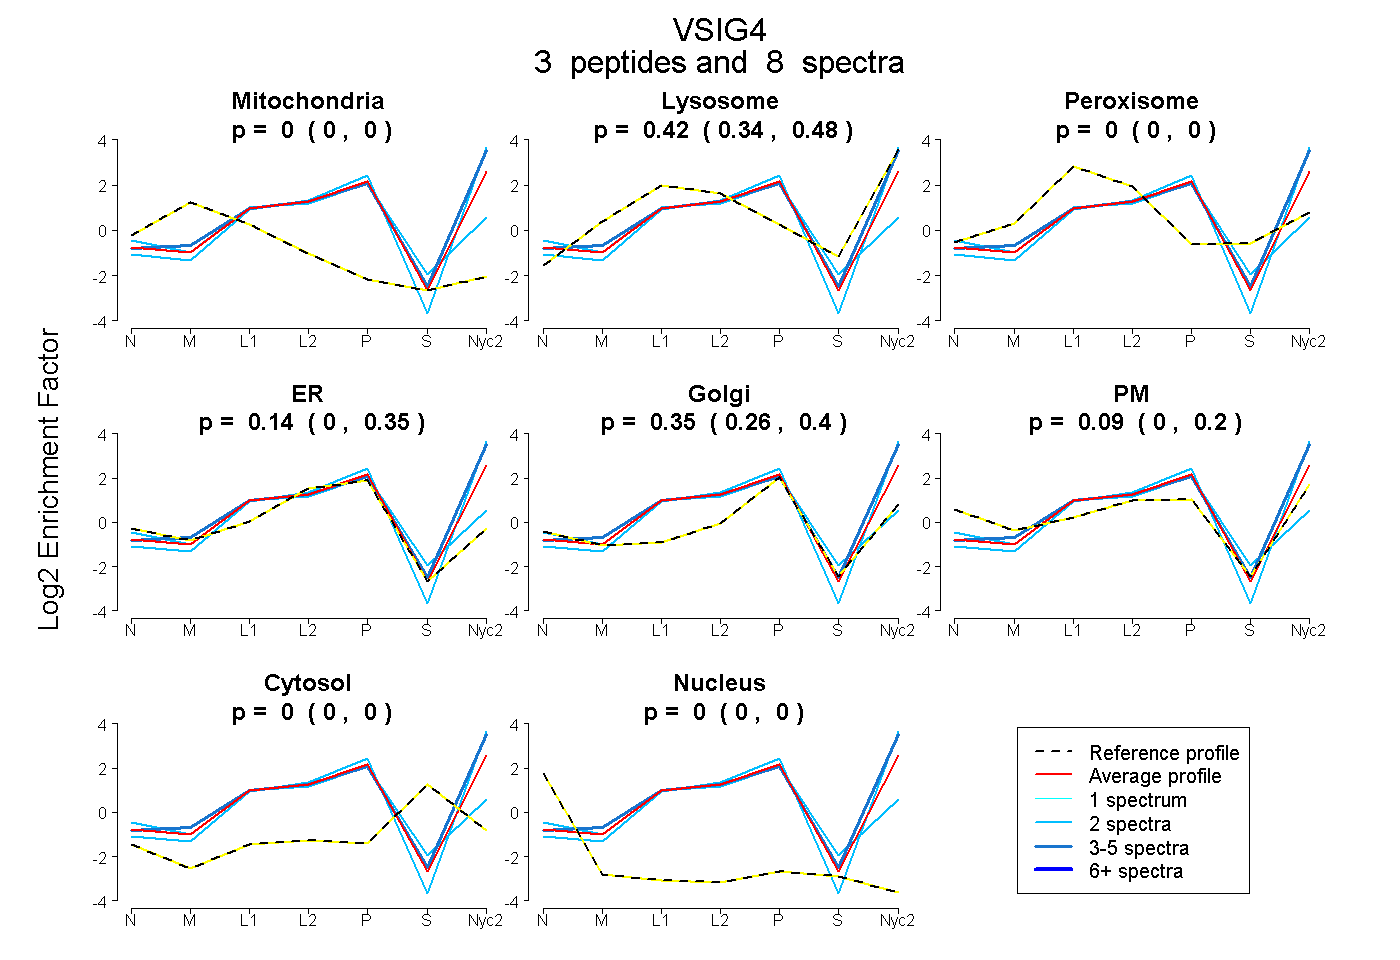
0.000 | 0.000
0.342 | 0.482
0.000 | 0.000
0.000 | 0.349
0.255 | 0.401
0.000 | 0.204
0.000 | 0.000
0.000 | 0.000
| Plot | Mito | Lyso | Perox | ER | Golgi | PM | Cytosol | Nucleus | |||||
| Expt A |
3 peptides |
8 spectra |
|
0.000 0.000 | 0.000 |
0.419 0.342 | 0.482 |
0.000 0.000 | 0.000 |
0.142 0.000 | 0.349 |
0.346 0.255 | 0.401 |
0.094 0.000 | 0.204 |
0.000 0.000 | 0.000 |
0.000 0.000 | 0.000 |
| 4 spectra, TFQEYVYEVSR | 0.000 | 0.544 | 0.000 | 0.000 | 0.300 | 0.156 | 0.000 | 0.000 | ||
| 2 spectra, IQCIYNPLTGYR | 0.000 | 0.130 | 0.105 | 0.597 | 0.168 | 0.000 | 0.000 | 0.000 | ||
| 2 spectra, QTSNSEETTR | 0.000 | 0.459 | 0.000 | 0.000 | 0.408 | 0.133 | 0.000 | 0.000 |
| Plot | Lyso | Other | |||||||||||
| Expt C |
1 peptide |
7 spectra |
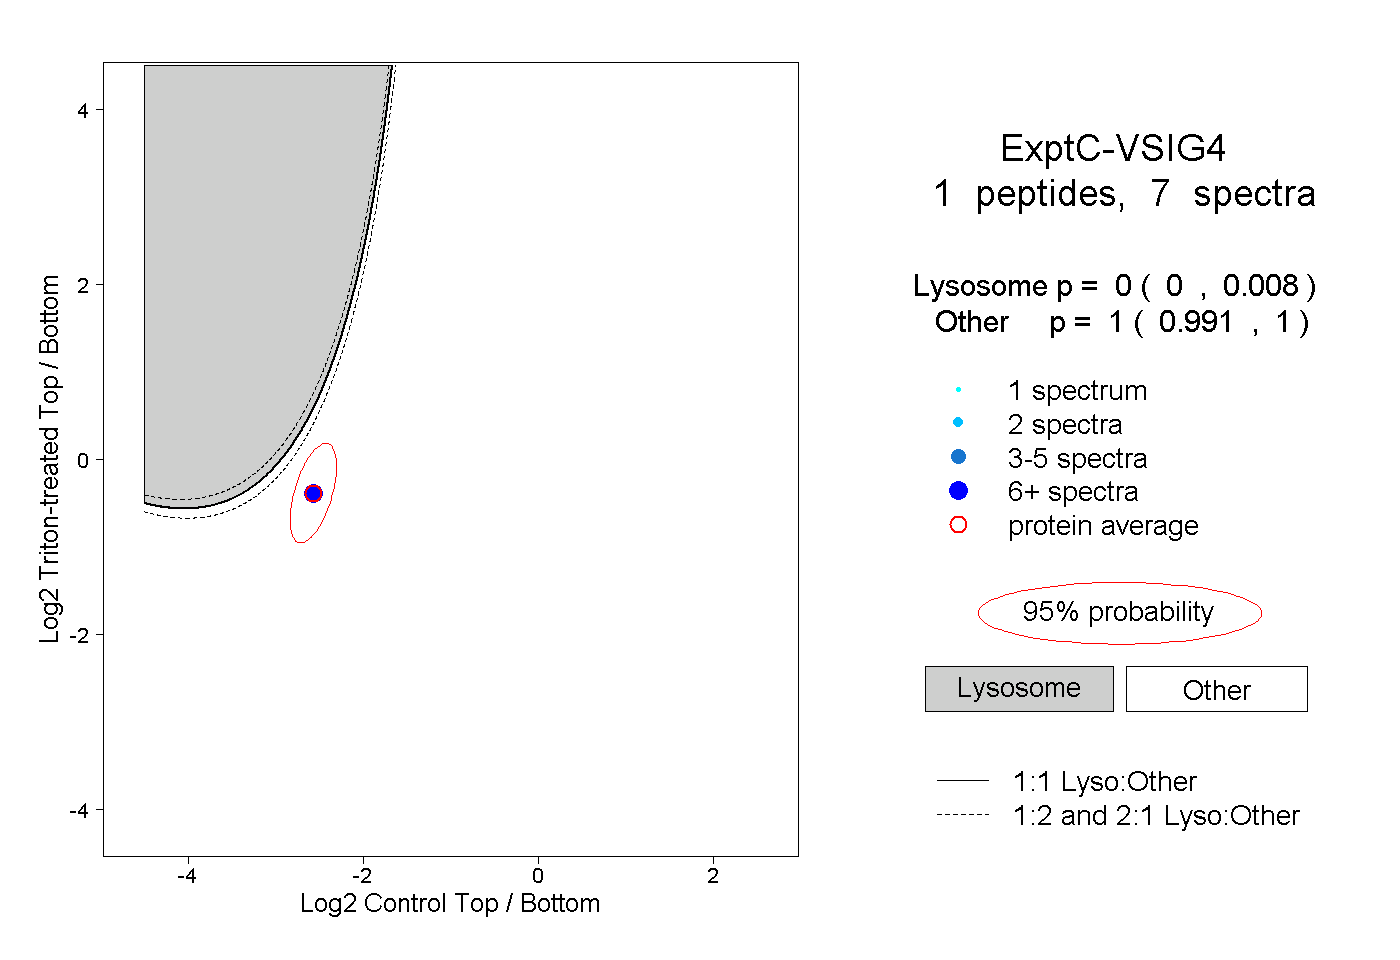 |
0.000 0.000 | 0.008 |
1.000 0.991 | 1.000 |