 19
19peptides
spectra
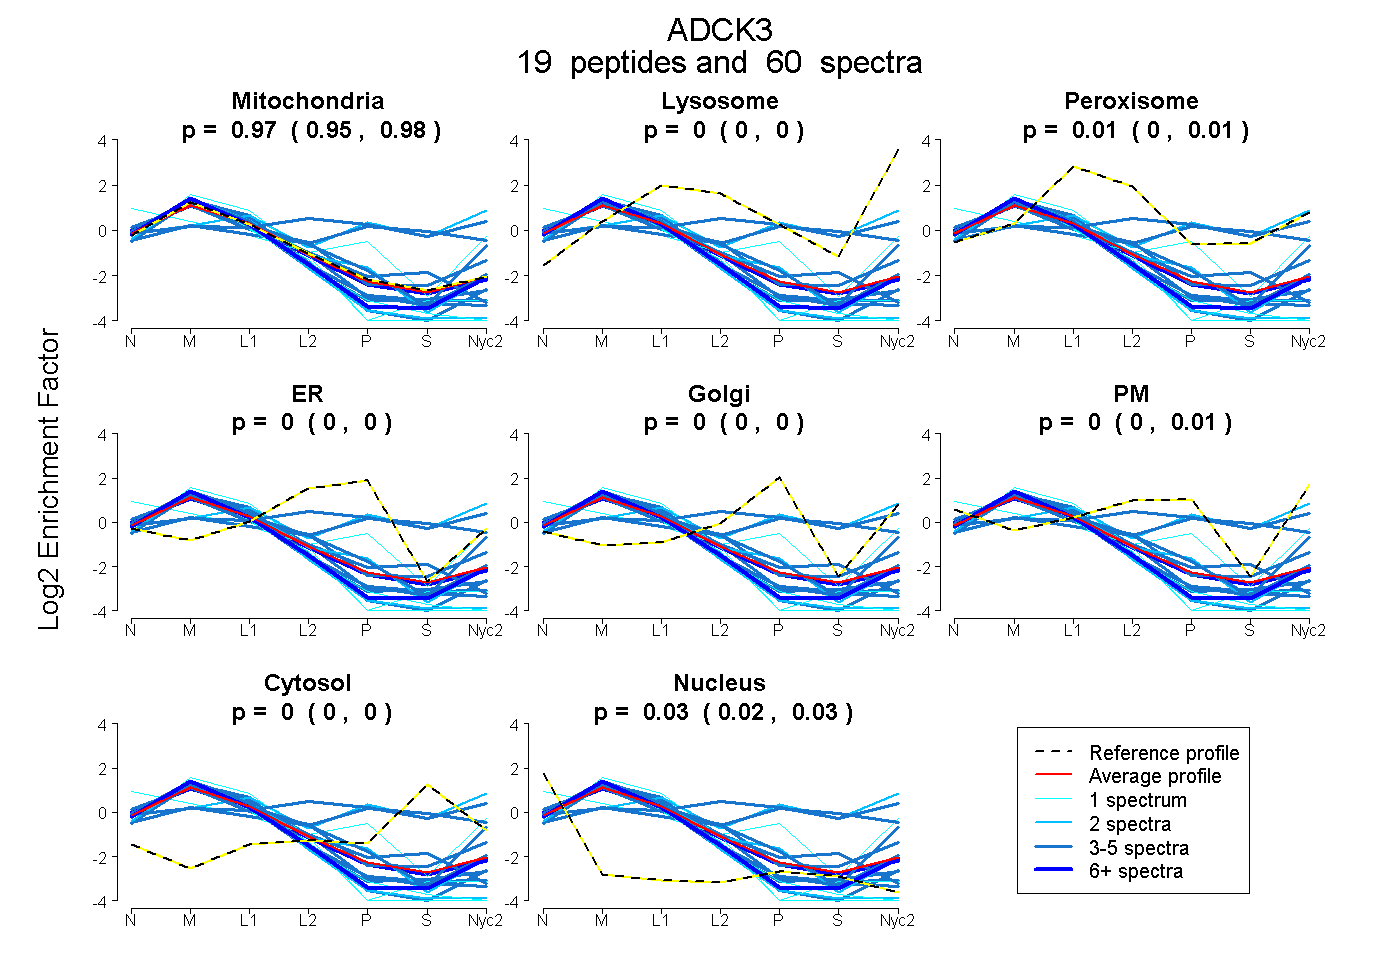
0.955 | 0.976
0.000 | 0.005
0.000 | 0.014
0.000 | 0.000
0.000 | 0.000
0.000 | 0.006
0.000 | 0.000
0.021 | 0.030
11peptides
spectra
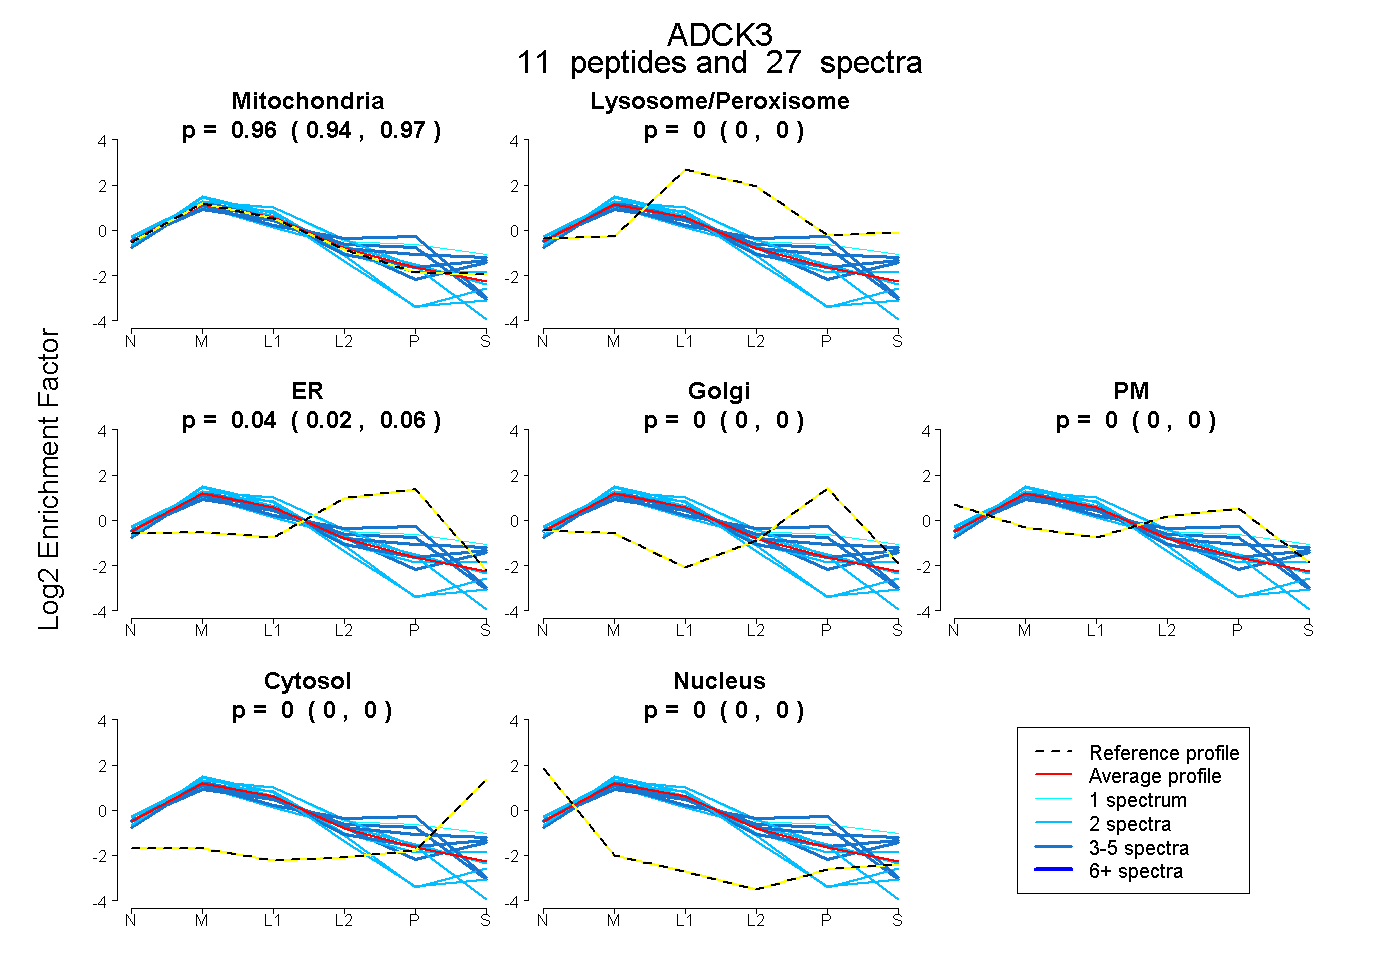
0.936 | 0.974
0.000 | 0.000
0.023 | 0.061
0.000 | 0.000
0.000 | 0.000
0.000 | 0.000
0.000 | 0.000
20peptides
spectra
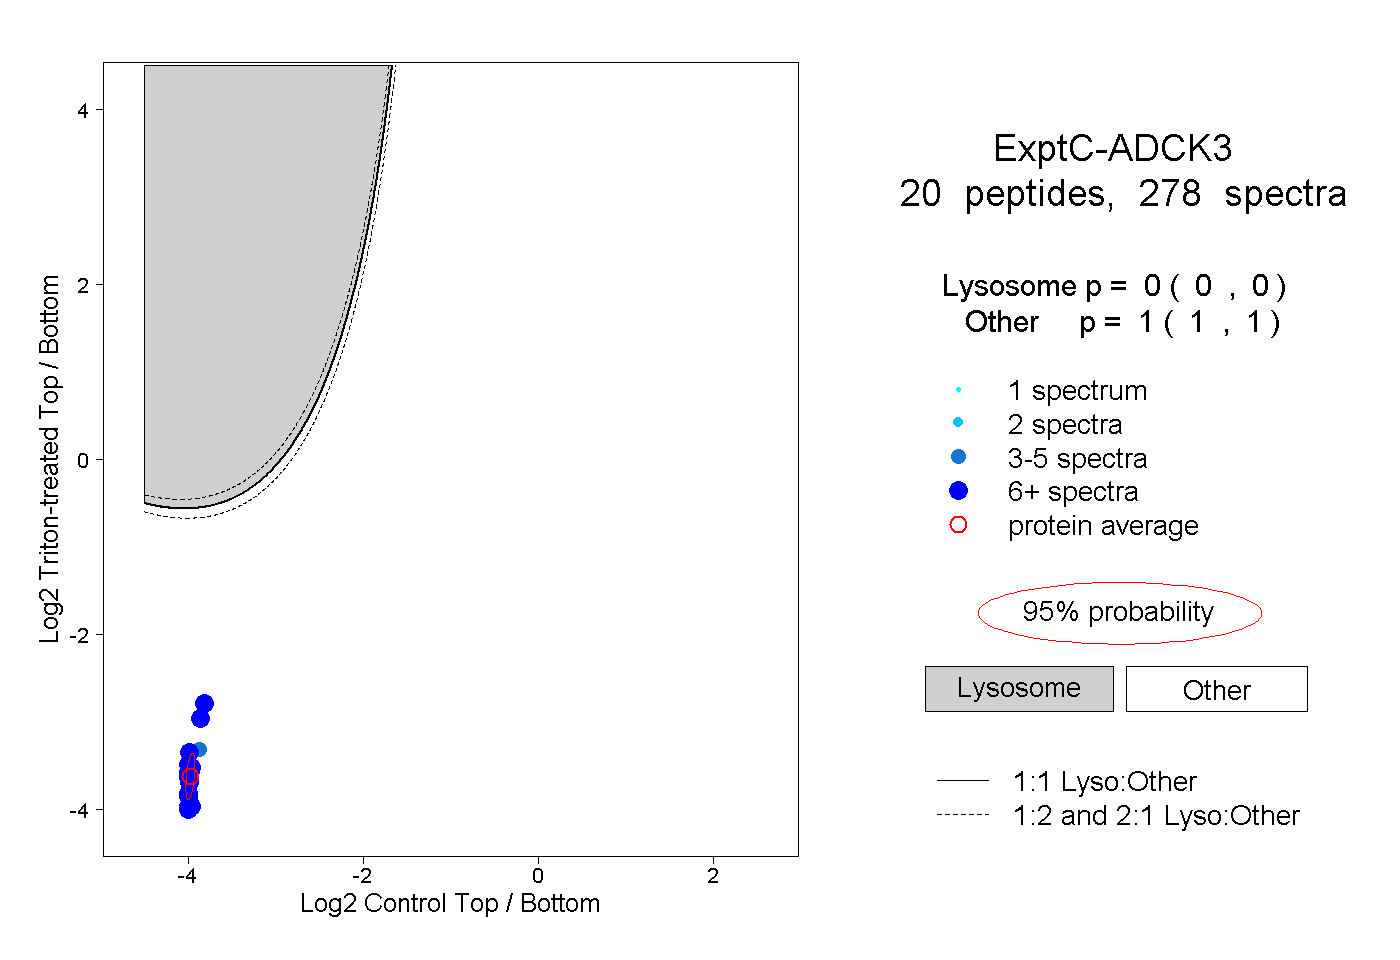
0.000 | 0.000
1.000 | 1.000
9peptides
spectra
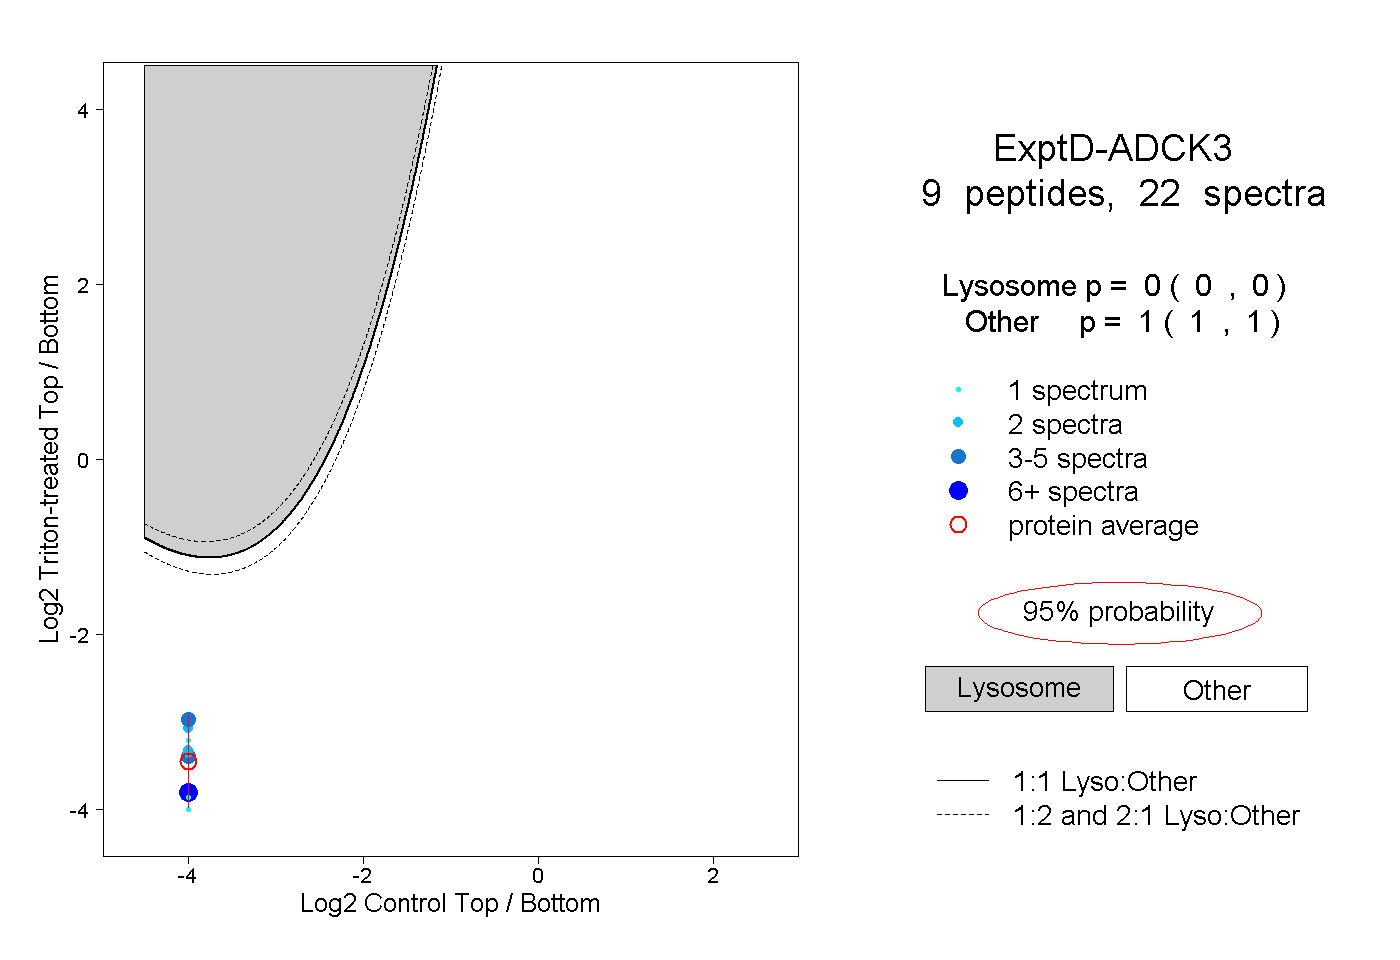
0.000 | 0.000
1.000 | 1.000