 19
19peptides
spectra
0.955 | 0.976
0.000 | 0.005
0.000 | 0.014
0.000 | 0.000
0.000 | 0.000
0.000 | 0.006
0.000 | 0.000
0.021 | 0.030
| Plot | Mito | Lyso | Perox | ER | Golgi | PM | Cytosol | Nucleus | |||||
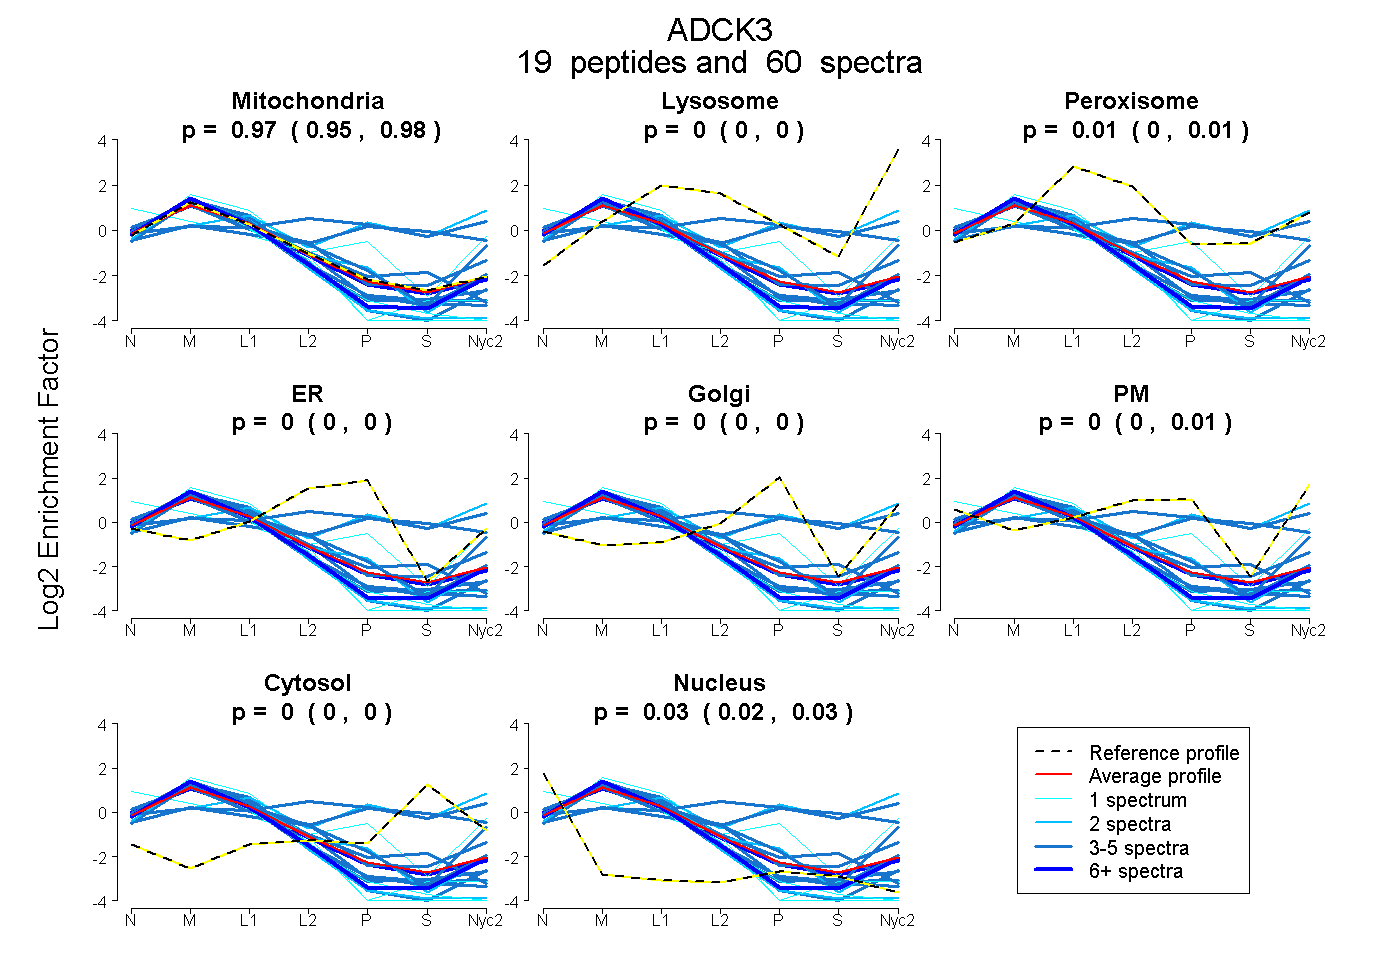
| Expt A |
19 peptides |
60 spectra |
|
0.968 0.955 | 0.976 |
0.000 0.000 | 0.005 |
0.007 0.000 | 0.014 |
0.000 0.000 | 0.000 |
0.000 0.000 | 0.000 |
0.000 0.000 | 0.006 |
0.000 0.000 | 0.000 |
0.026 0.021 | 0.030 |
| 3 spectra, LIPPPEETYSLHR | 0.207 | 0.000 | 0.208 | 0.000 | 0.268 | 0.000 | 0.317 | 0.000 | ||
| 1 spectrum, NEICYNILVLCLR | 0.876 | 0.000 | 0.000 | 0.000 | 0.000 | 0.000 | 0.000 | 0.124 | ||
| 4 spectra, SFTDLYIQVIR | 0.922 | 0.071 | 0.000 | 0.000 | 0.000 | 0.000 | 0.000 | 0.007 | ||
| 1 spectrum, LGQMLSIQDDAFINPHLAK | 0.915 | 0.000 | 0.000 | 0.000 | 0.000 | 0.000 | 0.000 | 0.085 | ||
| 4 spectra, MGGSFLICSK | 0.930 | 0.000 | 0.000 | 0.000 | 0.000 | 0.000 | 0.056 | 0.014 | ||
| 2 spectra, ELTLECDYQR | 0.887 | 0.000 | 0.000 | 0.000 | 0.000 | 0.000 | 0.000 | 0.113 | ||
| 2 spectra, EGPAPAYVSSGPFR | 0.145 | 0.221 | 0.129 | 0.000 | 0.178 | 0.092 | 0.236 | 0.000 | ||
| 4 spectra, AMFEEAYSNYCR | 0.951 | 0.000 | 0.000 | 0.000 | 0.000 | 0.000 | 0.000 | 0.049 | ||
| 3 spectra, IHNLIPIMLK | 0.849 | 0.102 | 0.003 | 0.000 | 0.000 | 0.000 | 0.000 | 0.046 | ||
| 3 spectra, AVLDSSPFLSEANAER | 0.957 | 0.000 | 0.000 | 0.000 | 0.000 | 0.000 | 0.000 | 0.043 | ||
| 3 spectra, QSADFMPLK | 0.061 | 0.000 | 0.307 | 0.000 | 0.108 | 0.280 | 0.244 | 0.000 | ||
| 5 spectra, AAADQDR | 0.935 | 0.000 | 0.000 | 0.000 | 0.000 | 0.000 | 0.000 | 0.065 | ||
| 7 spectra, VALLDFGATR | 0.963 | 0.000 | 0.000 | 0.000 | 0.000 | 0.000 | 0.000 | 0.037 | ||
| 2 spectra, QMLSER | 0.951 | 0.000 | 0.000 | 0.049 | 0.000 | 0.000 | 0.000 | 0.000 | ||
| 5 spectra, TLNNDLGPHWR | 0.889 | 0.000 | 0.000 | 0.101 | 0.000 | 0.000 | 0.000 | 0.010 | ||
| 1 spectrum, ELFEFHVMQTDPNWSNFFYDPQQHK | 0.984 | 0.000 | 0.000 | 0.000 | 0.000 | 0.000 | 0.000 | 0.016 | ||
| 6 spectra, EAGLSGQATSPLGR | 0.958 | 0.000 | 0.000 | 0.000 | 0.000 | 0.000 | 0.000 | 0.042 | ||
| 1 spectrum, EAVLK | 0.392 | 0.000 | 0.000 | 0.000 | 0.000 | 0.470 | 0.000 | 0.138 | ||
| 3 spectra, ALQSTAVEQISMVFGK | 0.951 | 0.000 | 0.000 | 0.000 | 0.000 | 0.000 | 0.000 | 0.049 |
| Plot | Mito | Lyso or Perox | ER | Golgi | PM | Cytosol | Nucleus | ||||||
| Expt B |
11 peptides |
27 spectra |
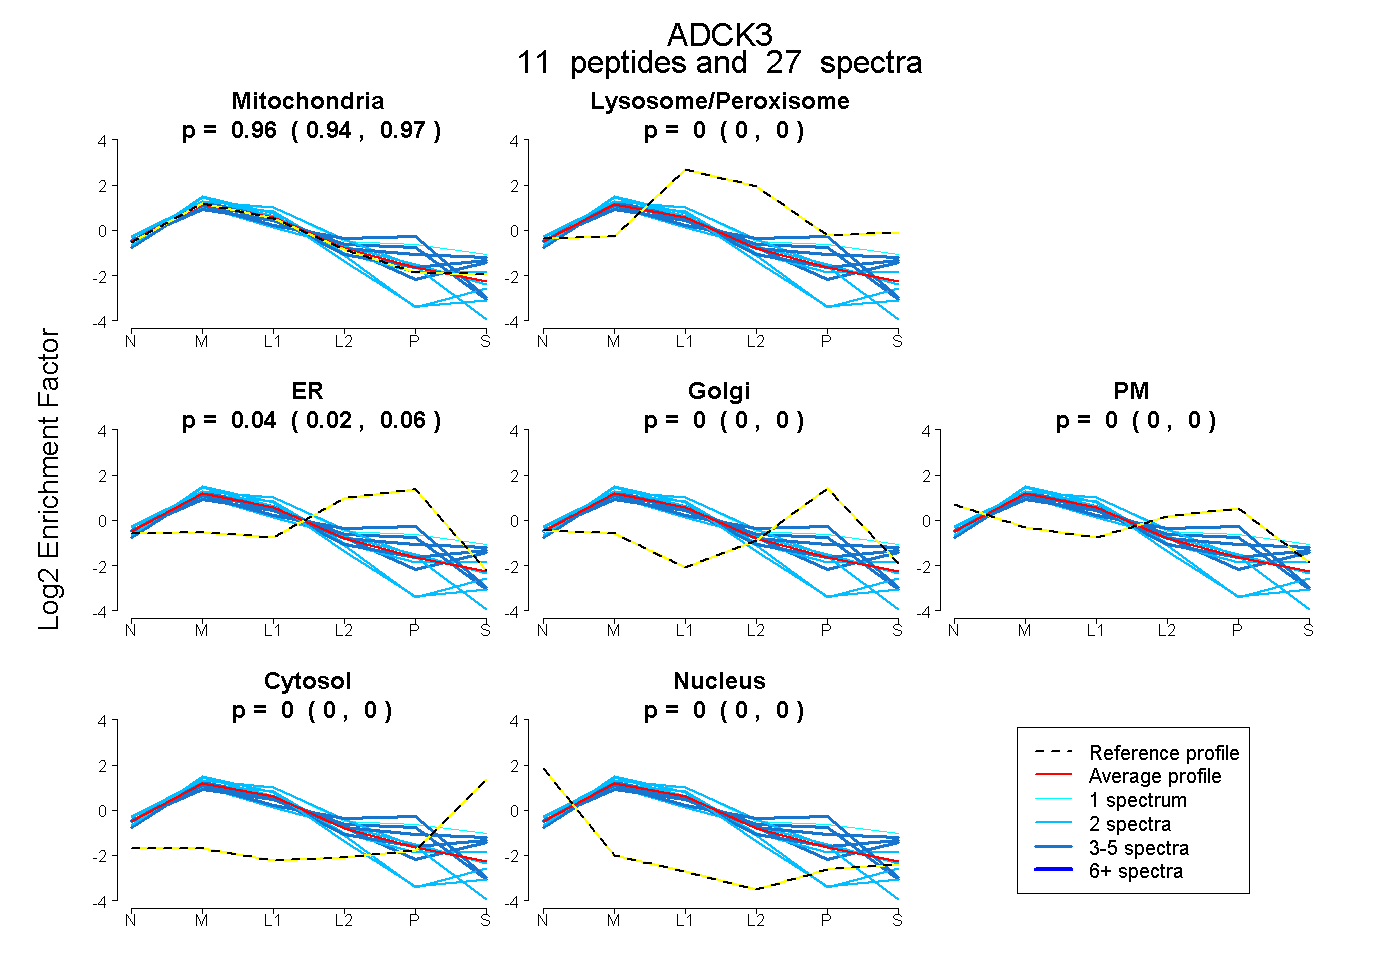 |
0.956 0.936 | 0.974 |
0.000 0.000 | 0.000 |
0.044 0.023 | 0.061 |
0.000 0.000 | 0.000 |
0.000 0.000 | 0.000 |
0.000 0.000 | 0.000 |
0.000 0.000 | 0.000 |
|||
| Plot | Lyso | Other | |||||||||||
| Expt C |
20 peptides |
278 spectra |
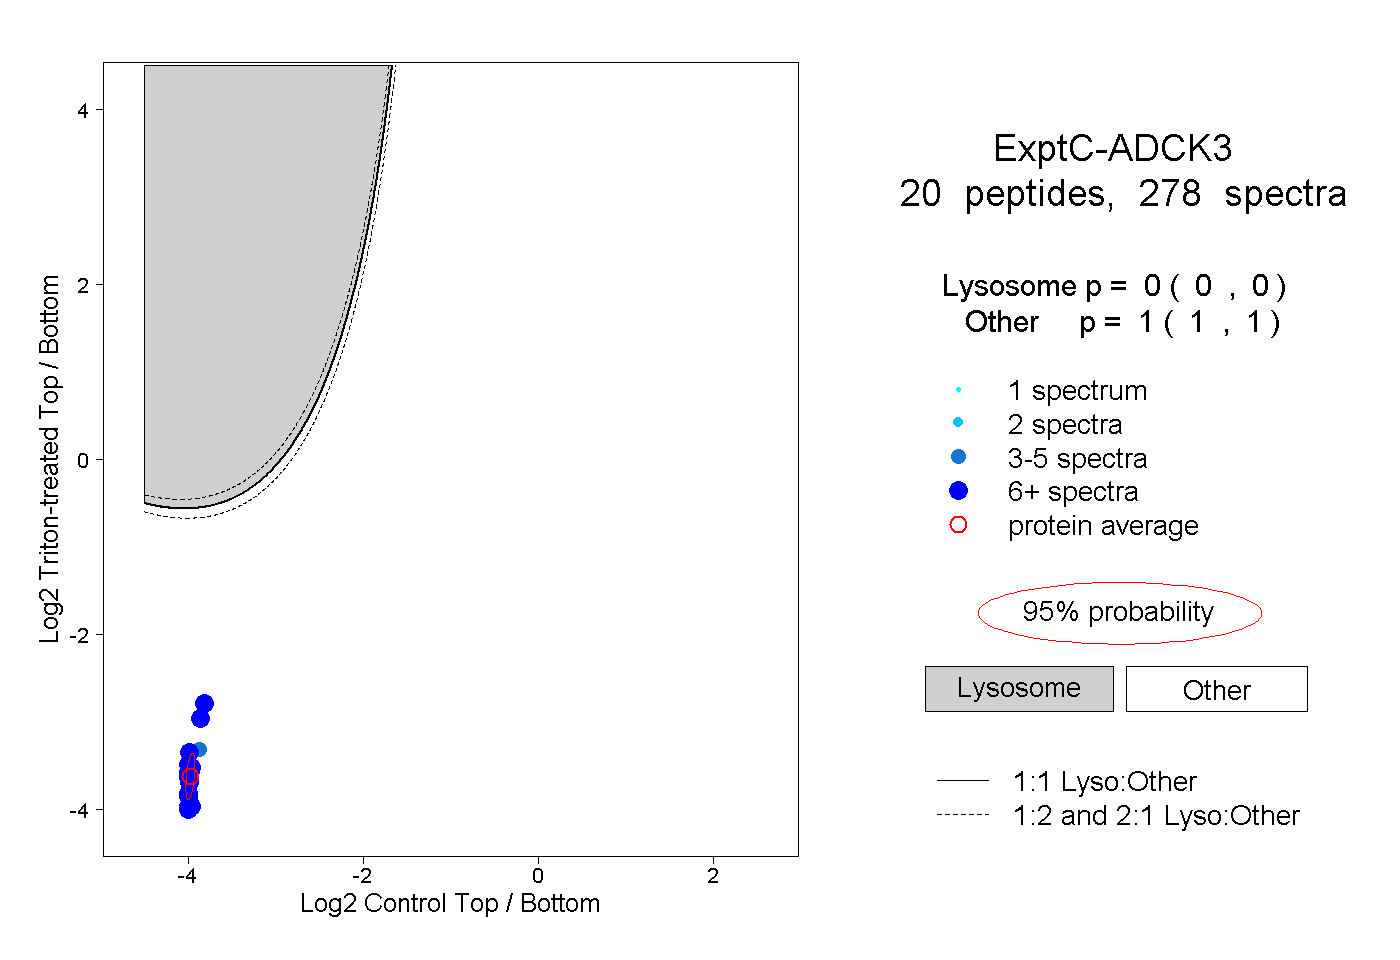 |
0.000 0.000 | 0.000 |
1.000 1.000 | 1.000 |
||||||||
| Plot | Lyso | Other | |||||||||||
| Expt D |
9 peptides |
22 spectra |
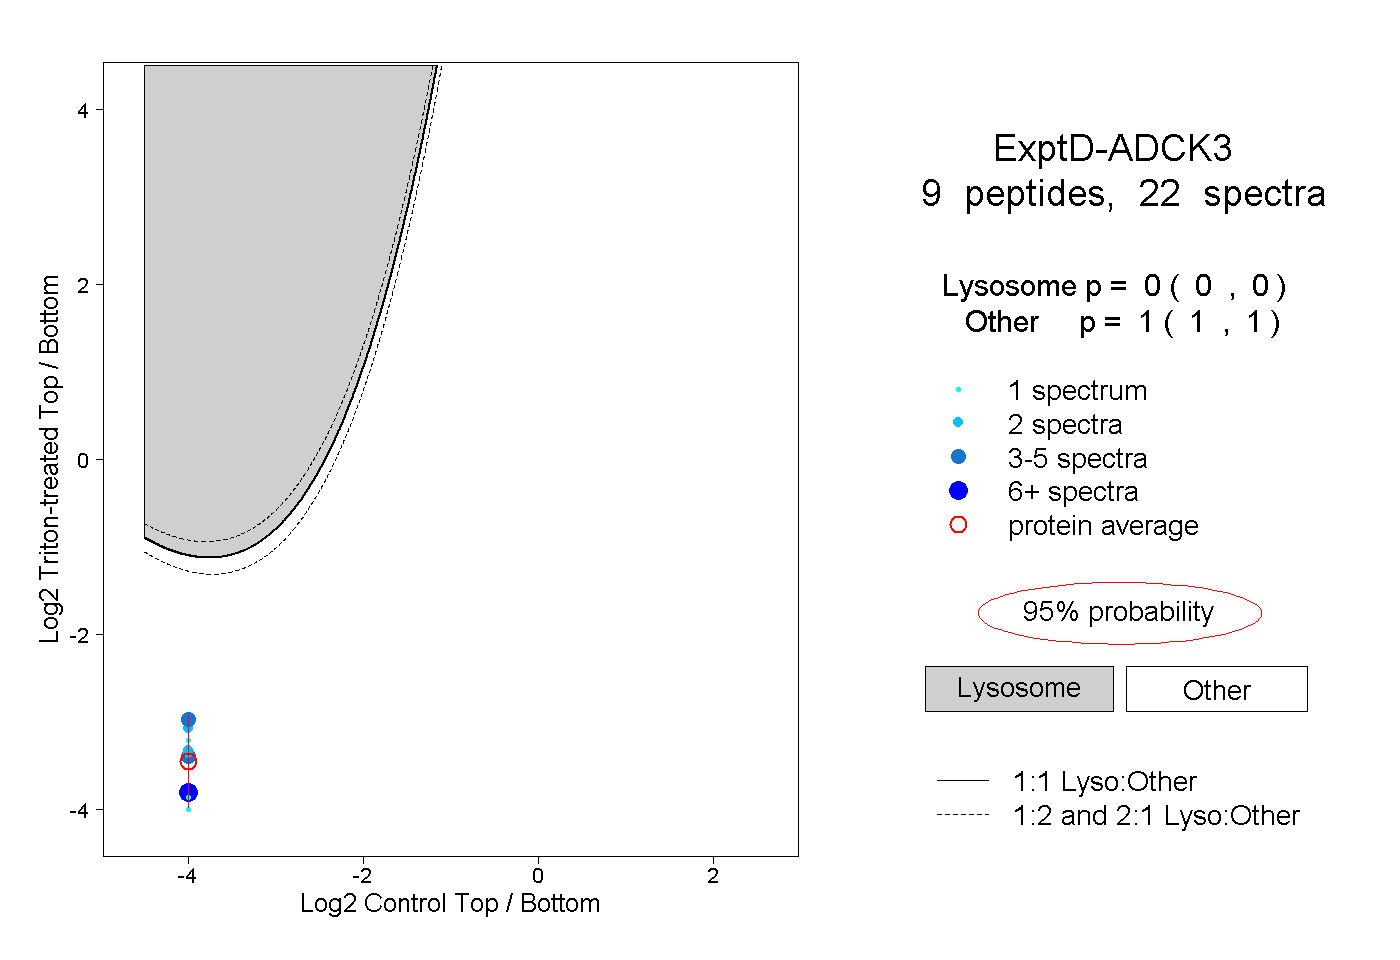 |
0.000 0.000 | 0.000 |
1.000 1.000 | 1.000 |