 6
6peptides
spectra
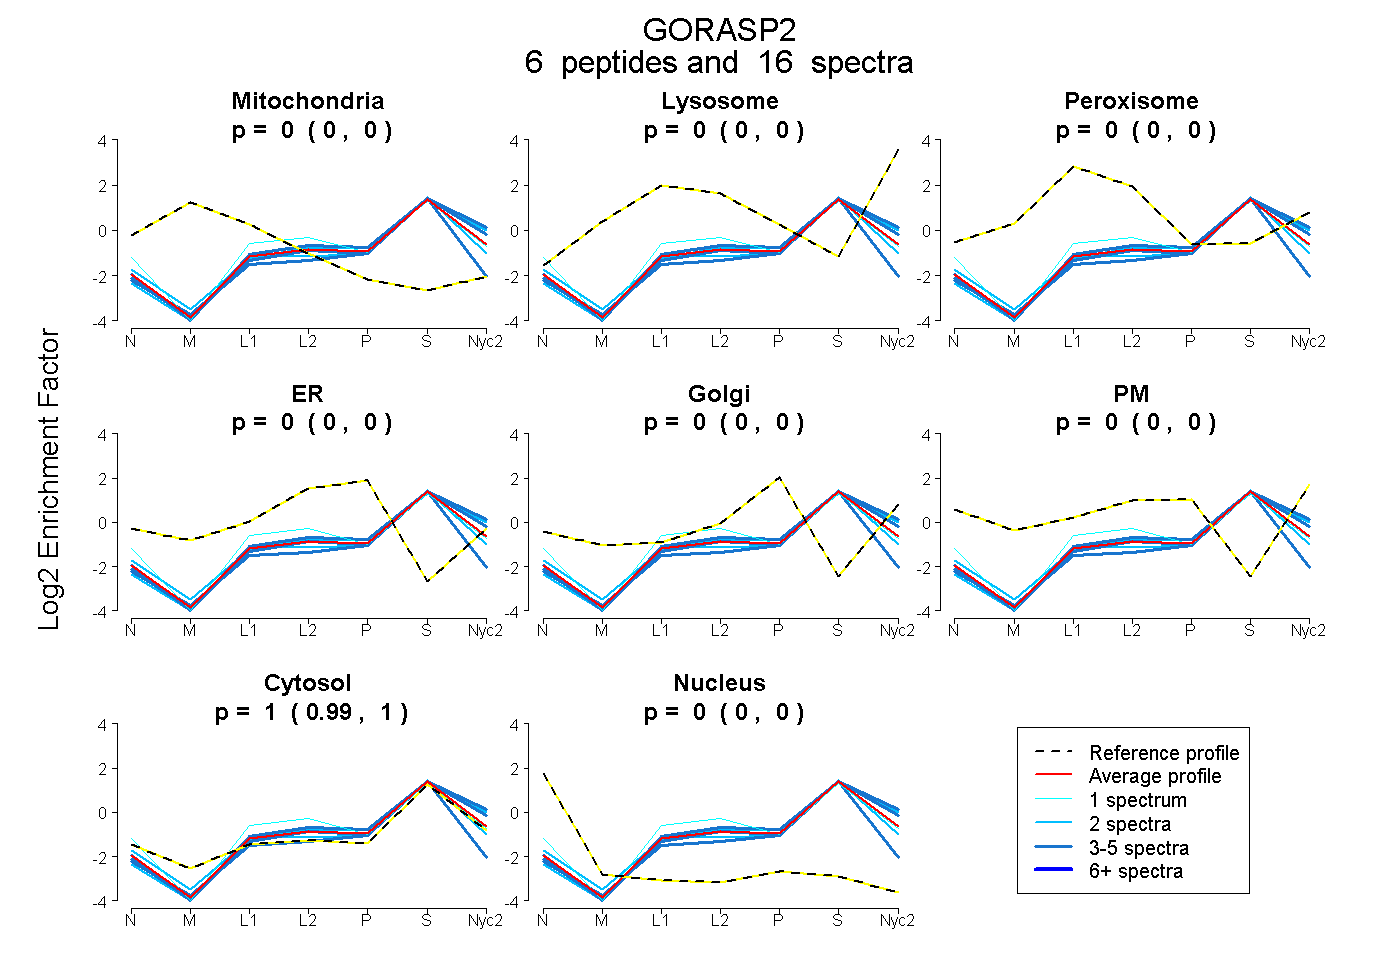
0.000 | 0.000
0.000 | 0.005
0.000 | 0.000
0.000 | 0.000
0.000 | 0.000
0.000 | 0.000
0.993 | 1.000
0.000 | 0.000
2peptides
spectra
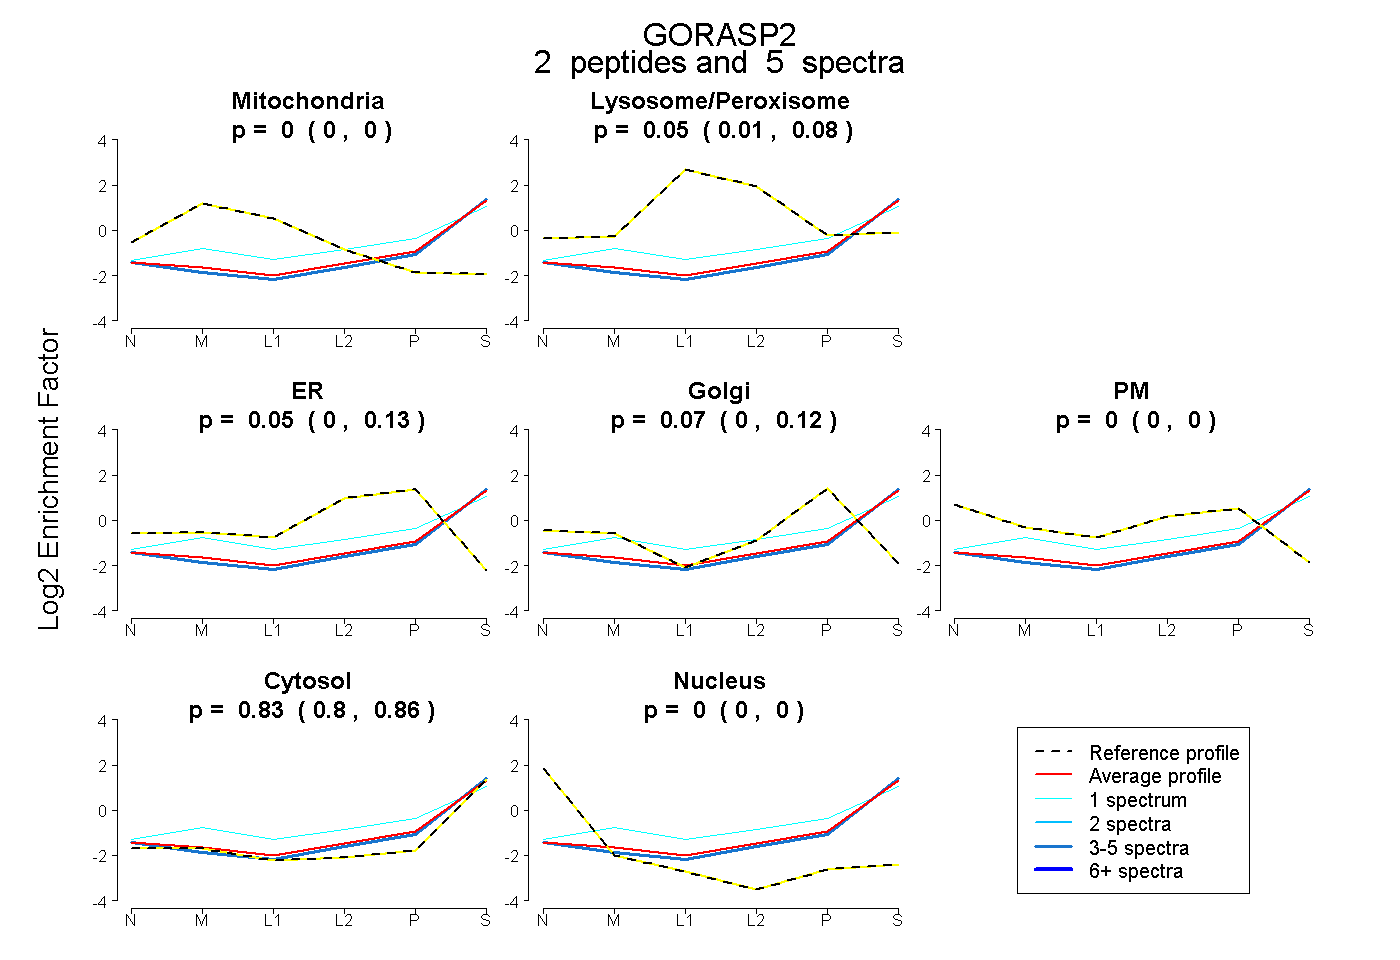
0.000 | 0.000
0.008 | 0.084
0.000 | 0.132
0.000 | 0.125
0.000 | 0.000
0.800 | 0.858
0.000 | 0.000
7peptides
spectra
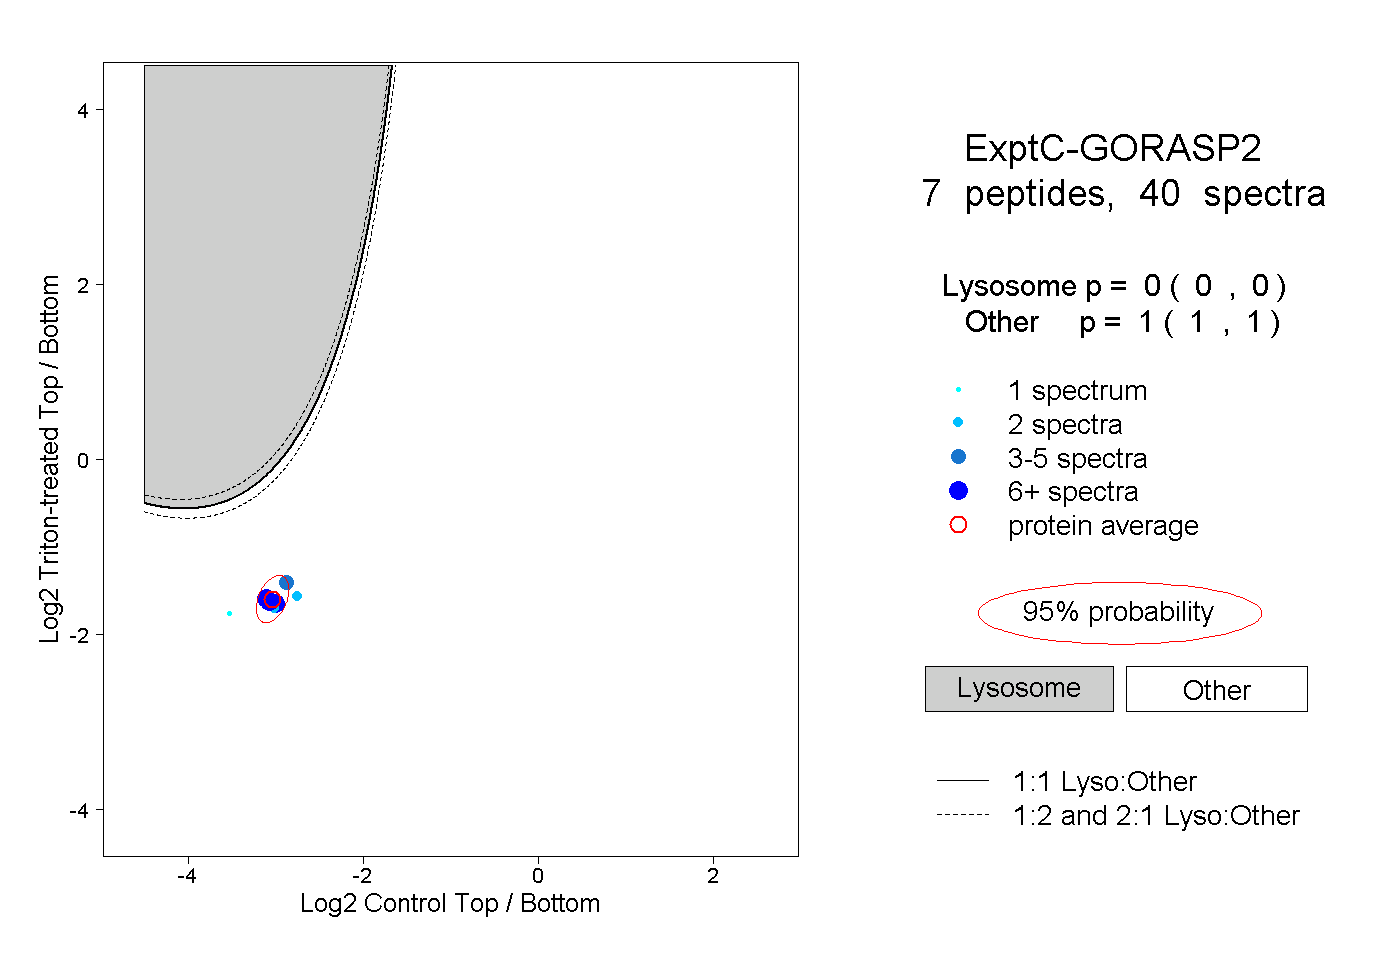
0.000 | 0.000
1.000 | 1.000