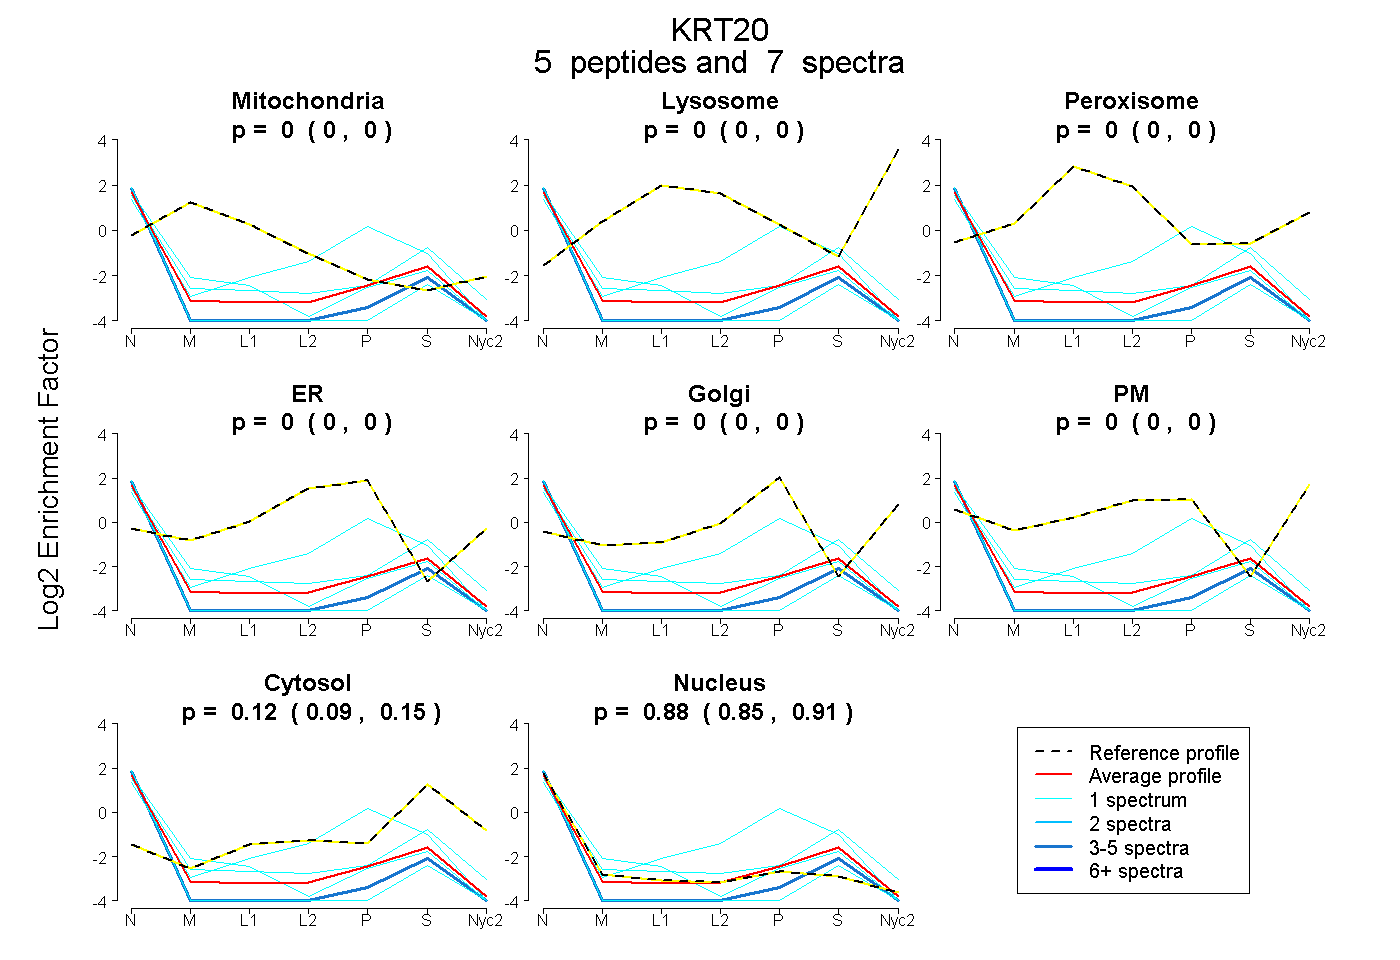
 5
5peptides
spectra
0.000 | 0.000
0.000 | 0.000
0.000 | 0.000
0.000 | 0.000
0.000 | 0.000
0.000 | 0.000
0.086 | 0.146
0.847 | 0.908
| Plot | Mito | Lyso | Perox | ER | Golgi | PM | Cytosol | Nucleus | |||||
| Expt A |
5 peptides |
7 spectra |
|
0.000 0.000 | 0.000 |
0.000 0.000 | 0.000 |
0.000 0.000 | 0.000 |
0.000 0.000 | 0.000 |
0.000 0.000 | 0.000 |
0.000 0.000 | 0.000 |
0.120 0.086 | 0.146 |
0.880 0.847 | 0.908 |
| 1 spectrum, TVVEEVVDGK | 0.000 | 0.000 | 0.000 | 0.000 | 0.000 | 0.000 | 0.000 | 1.000 | ||
| 1 spectrum, QNQEYNILLDIK | 0.000 | 0.000 | 0.000 | 0.245 | 0.000 | 0.000 | 0.172 | 0.582 | ||
| 1 spectrum, QVTVNIEELR | 0.053 | 0.000 | 0.000 | 0.000 | 0.000 | 0.000 | 0.066 | 0.881 | ||
| 1 spectrum, LAMQNLNDR | 0.000 | 0.000 | 0.000 | 0.000 | 0.000 | 0.000 | 0.301 | 0.699 | ||
| 3 spectra, LLEGEDIK | 0.000 | 0.000 | 0.000 | 0.000 | 0.000 | 0.000 | 0.000 | 1.000 |
| Plot | Mito | Lyso or Perox | ER | Golgi | PM | Cytosol | Nucleus | ||||||
| Expt B |
2 peptides |
2 spectra |
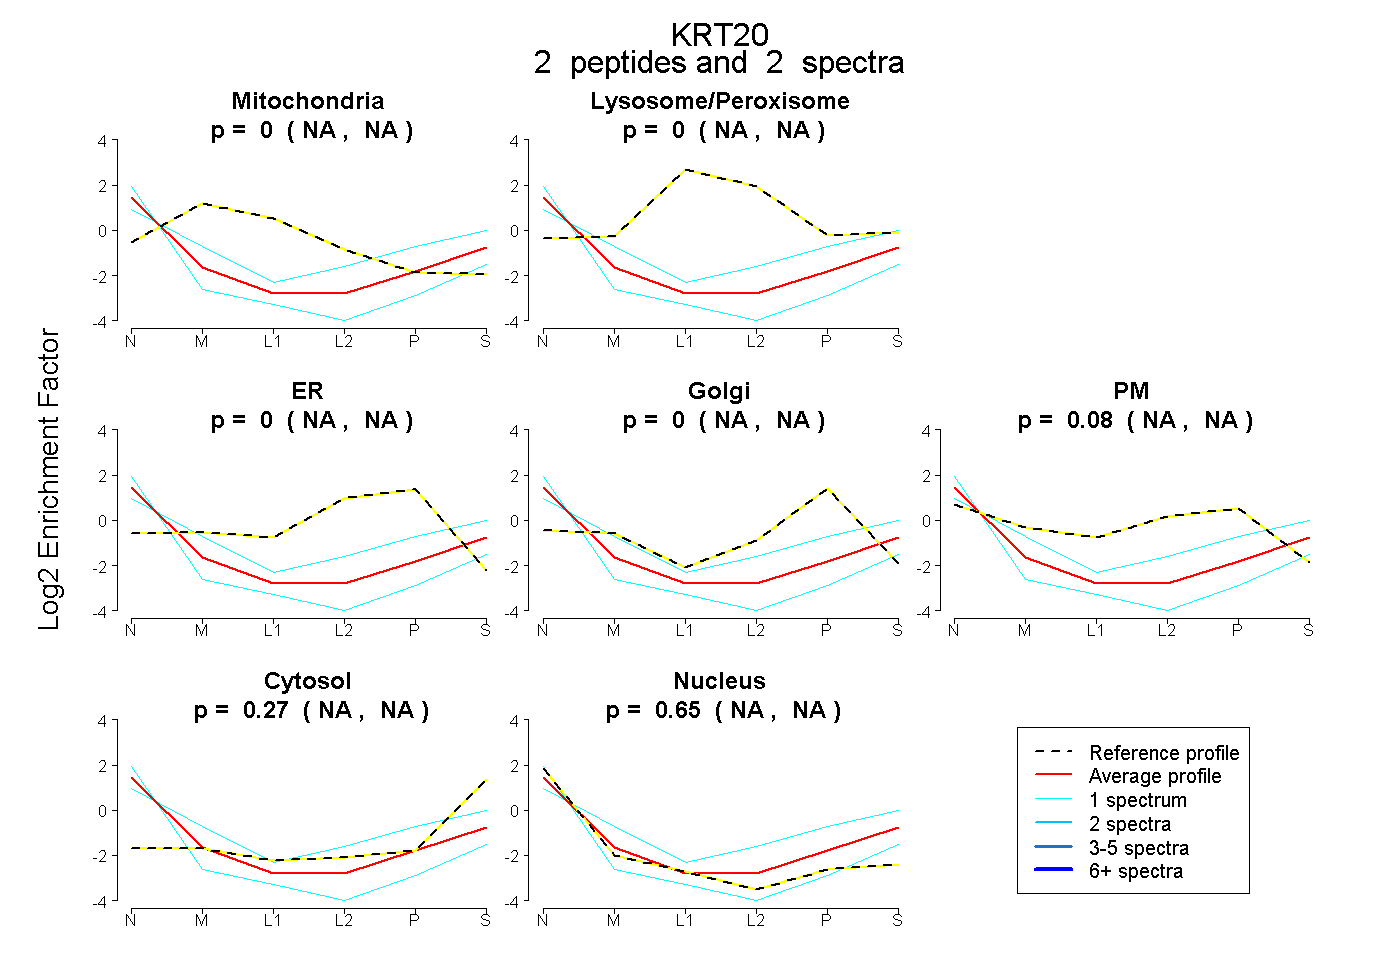 |
0.000 NA | NA |
0.000 NA | NA |
0.000 NA | NA |
0.000 NA | NA |
0.083 NA | NA |
0.269 NA | NA |
0.648 NA | NA |