 15
15peptides
spectra
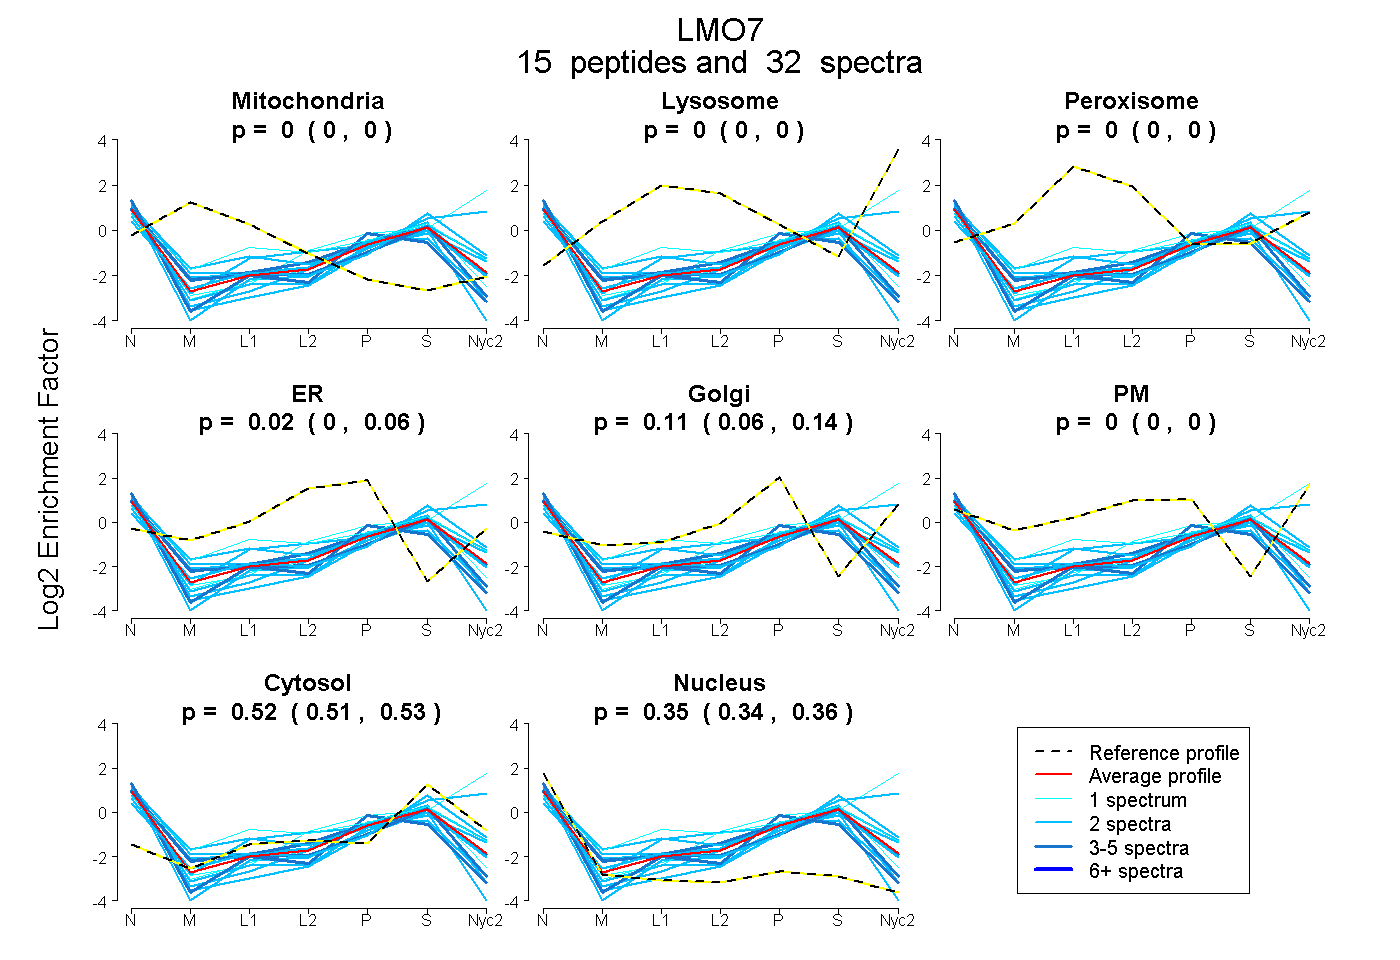
0.000 | 0.000
0.000 | 0.000
0.000 | 0.000
0.000 | 0.055
0.061 | 0.135
0.000 | 0.003
0.515 | 0.527
0.339 | 0.358
5peptides
spectra
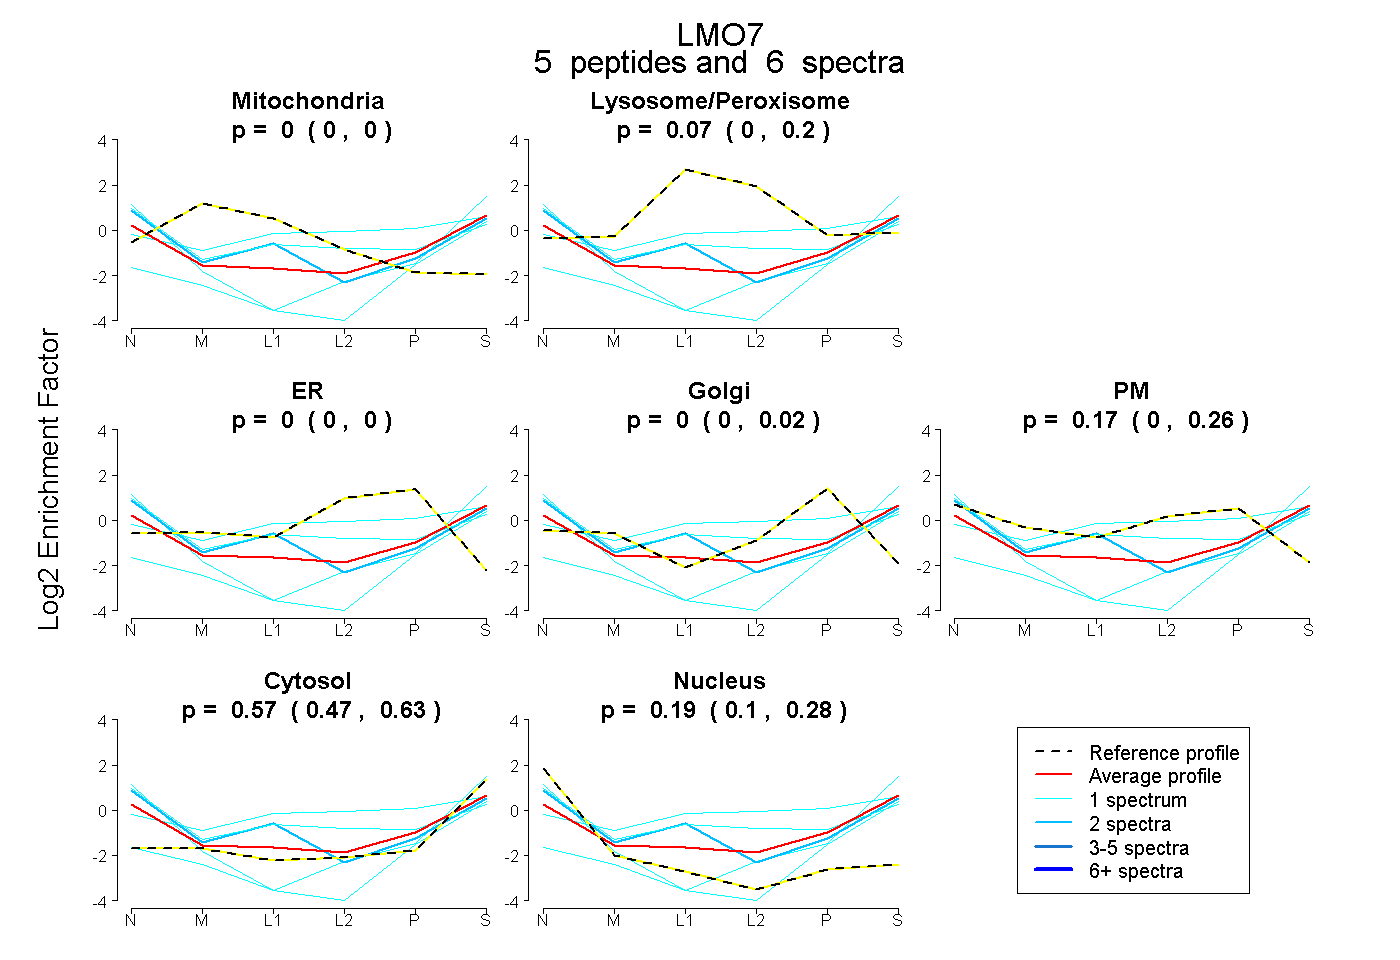
0.000 | 0.000
0.000 | 0.196
0.000 | 0.000
0.000 | 0.024
0.000 | 0.261
0.475 | 0.632
0.104 | 0.285