 4
4peptides
spectra
0.000 | 0.000
0.136 | 0.302
0.000 | 0.000
0.000 | 0.000
0.219 | 0.554
0.000 | 0.309
0.138 | 0.292
0.000 | 0.000
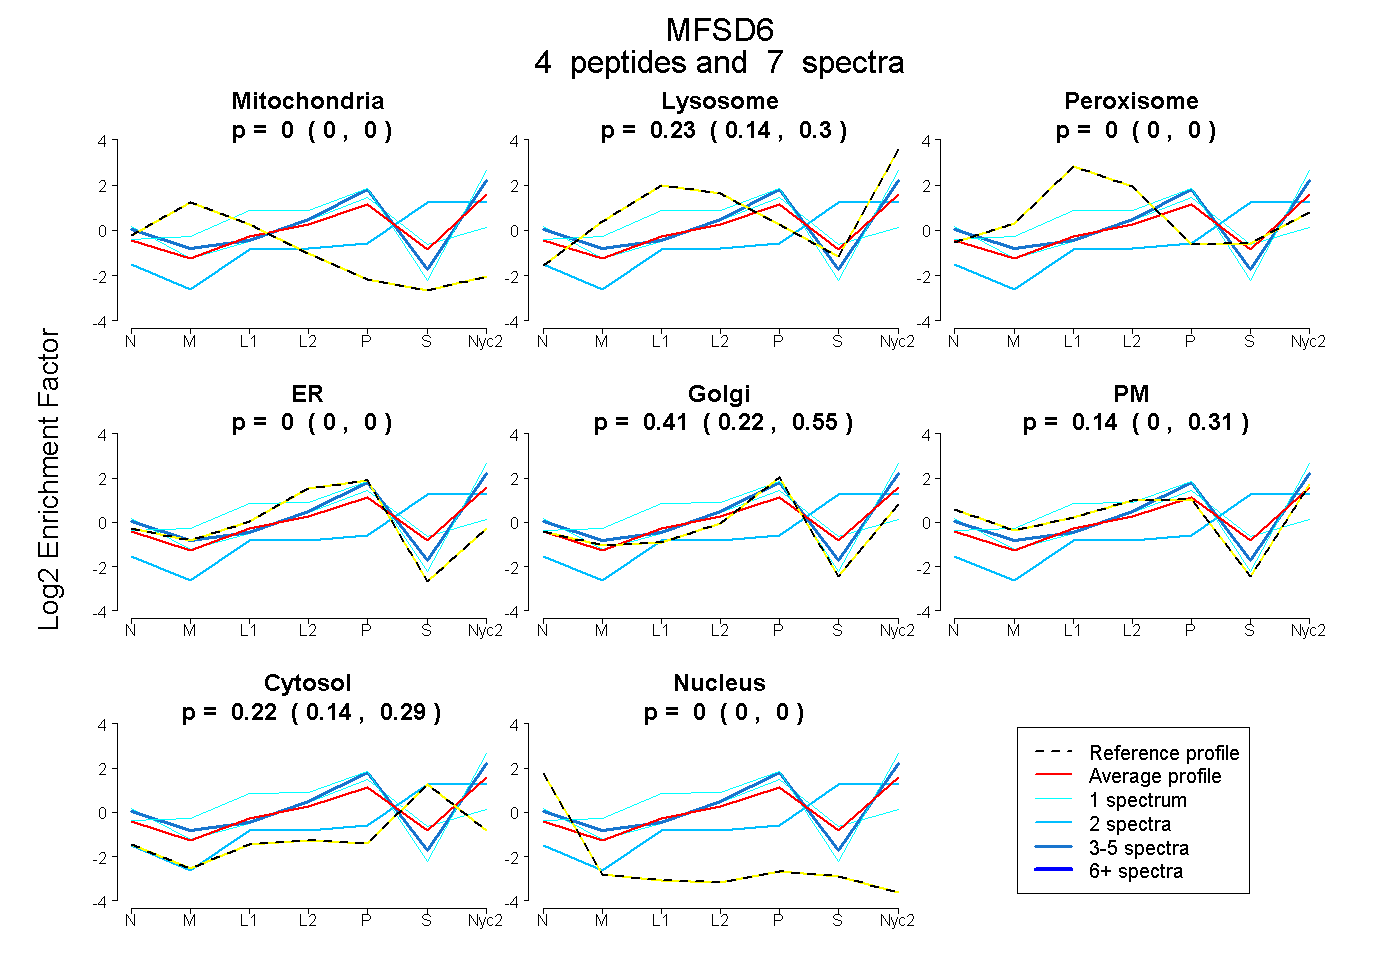
| Plot | Mito | Lyso | Perox | ER | Golgi | PM | Cytosol | Nucleus | |||||
| Expt A |
4 peptides |
7 spectra |
|
0.000 0.000 | 0.000 |
0.229 0.136 | 0.302 |
0.000 0.000 | 0.000 |
0.000 0.000 | 0.000 |
0.407 0.219 | 0.554 |
0.144 0.000 | 0.309 |
0.220 0.138 | 0.292 |
0.000 0.000 | 0.000 |
| 2 spectra, AADDK | 0.000 | 0.242 | 0.000 | 0.000 | 0.000 | 0.000 | 0.758 | 0.000 | ||
| 1 spectrum, TSAQGILQGLHLGLGR | 0.000 | 0.390 | 0.000 | 0.000 | 0.285 | 0.326 | 0.000 | 0.000 | ||
| 1 spectrum, ASEIQPLQGIHENR | 0.000 | 0.000 | 0.000 | 0.331 | 0.158 | 0.221 | 0.289 | 0.000 | ||
| 3 spectra, LIELIGHIR | 0.000 | 0.171 | 0.000 | 0.000 | 0.545 | 0.284 | 0.000 | 0.000 |
| Plot | Lyso | Other | |||||||||||
| Expt C |
1 peptide |
8 spectra |
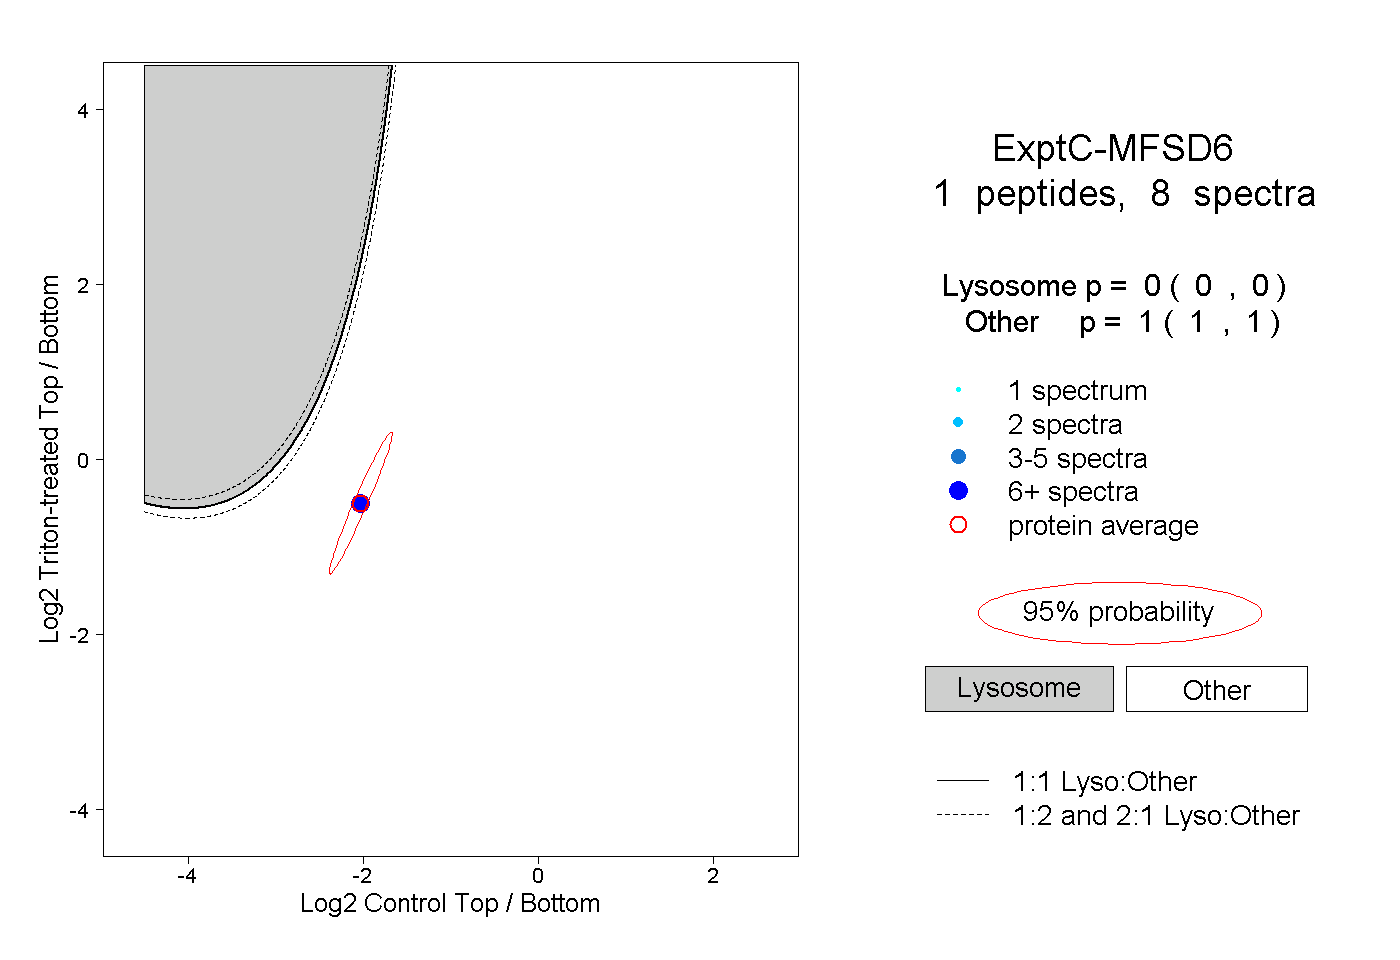 |
0.000 0.000 | 0.000 |
1.000 1.000 | 1.000 |