 3
3peptides
spectra
0.000 | 0.000
0.000 | 0.000
0.000 | 0.000
0.177 | 0.724
0.000 | 0.357
0.000 | 0.176
0.031 | 0.295
0.020 | 0.259
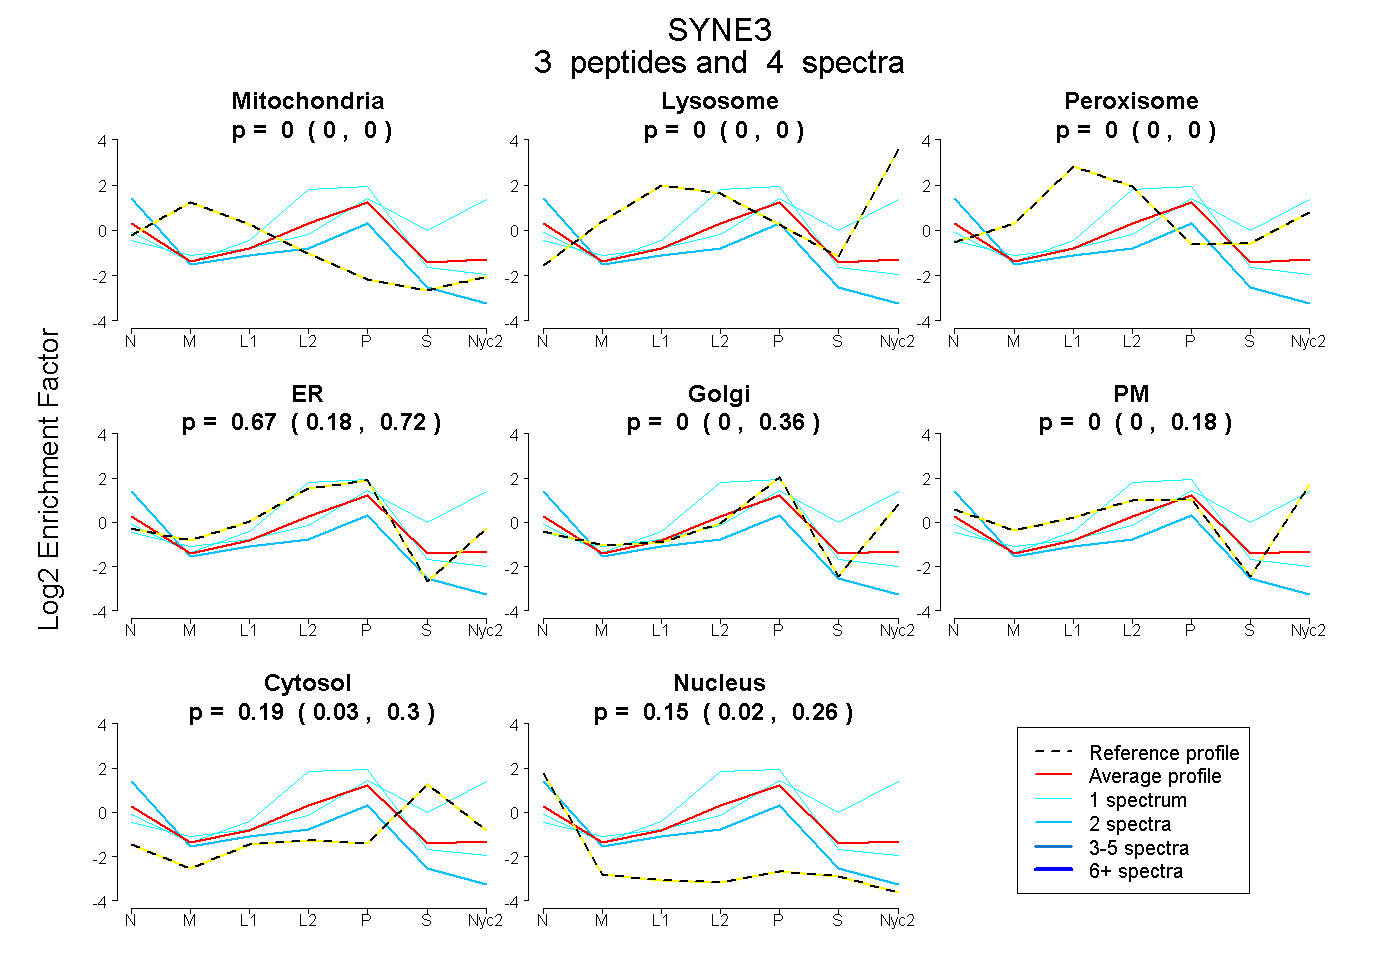
| Plot | Mito | Lyso | Perox | ER | Golgi | PM | Cytosol | Nucleus | |||||
| Expt A |
3 peptides |
4 spectra |
|
0.000 0.000 | 0.000 |
0.000 0.000 | 0.000 |
0.000 0.000 | 0.000 |
0.665 0.177 | 0.724 |
0.000 0.000 | 0.357 |
0.000 0.000 | 0.176 |
0.188 0.031 | 0.295 |
0.146 0.020 | 0.259 |