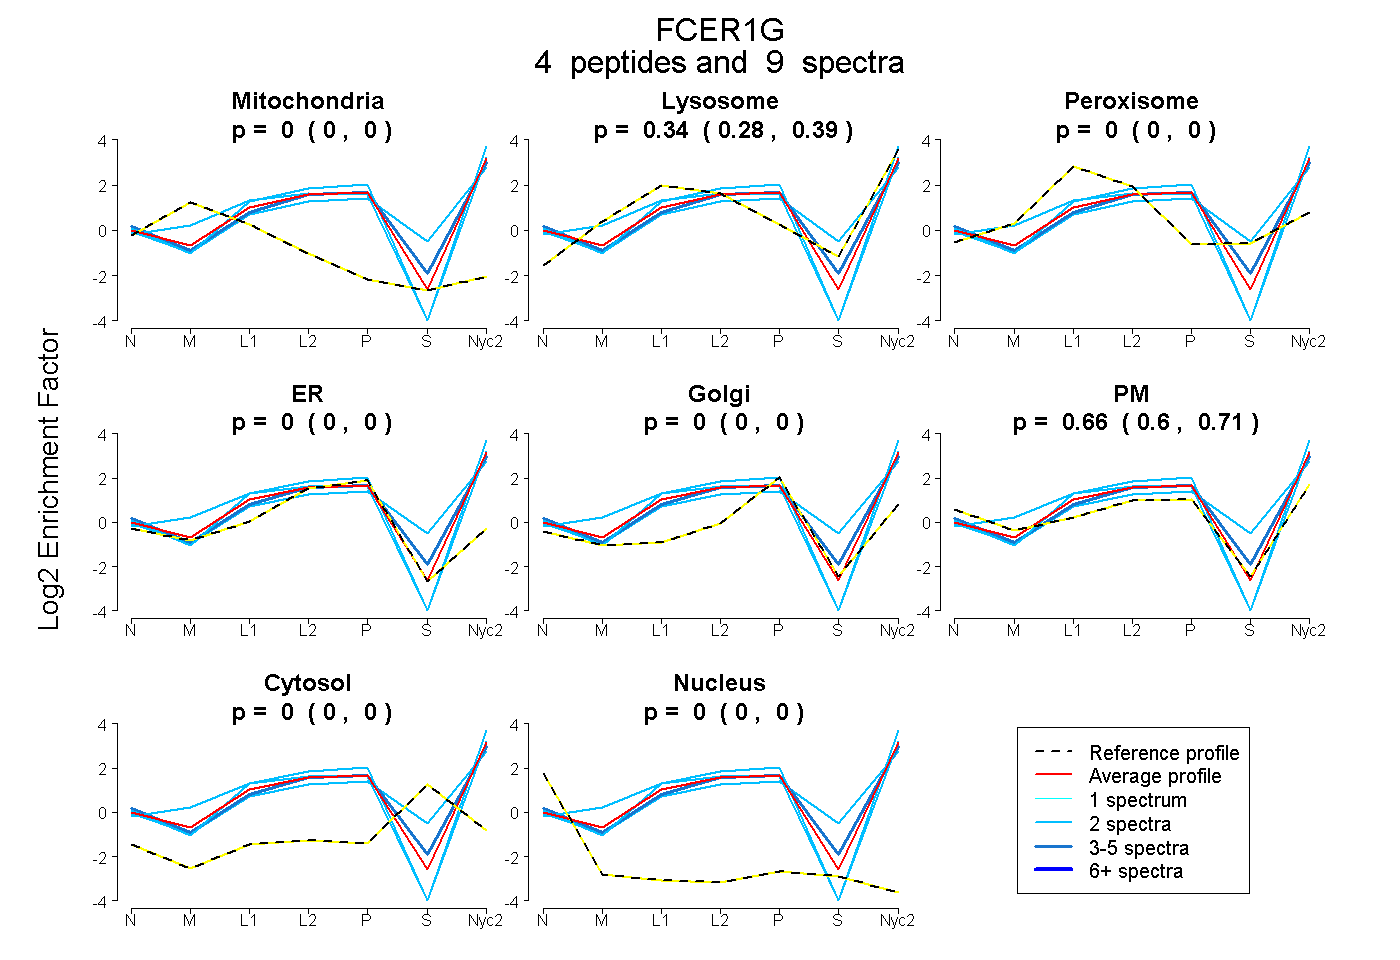
 4
4peptides
spectra
0.000 | 0.000
0.278 | 0.389
0.000 | 0.000
0.000 | 0.000
0.000 | 0.000
0.602 | 0.711
0.000 | 0.000
0.000 | 0.000
4peptides
spectra
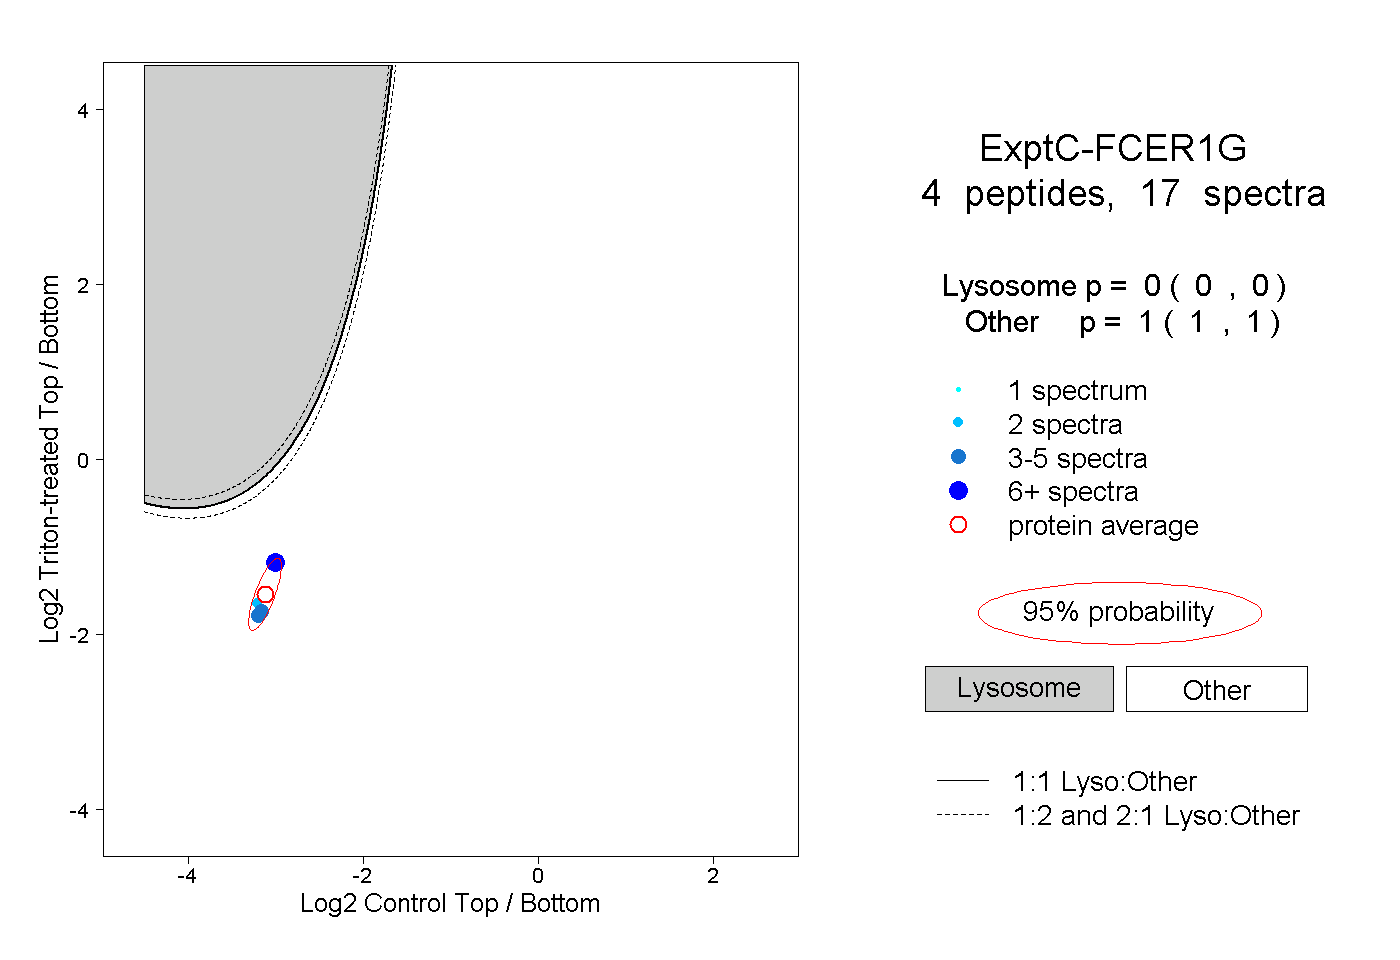
0.000 | 0.000
1.000 | 1.000
| Plot | Mito | Lyso | Perox | ER | Golgi | PM | Cytosol | Nucleus | |||||
| Expt A |
4 peptides |
9 spectra |
|
0.000 0.000 | 0.000 |
0.336 0.278 | 0.389 |
0.000 0.000 | 0.000 |
0.000 0.000 | 0.000 |
0.000 0.000 | 0.000 |
0.664 0.602 | 0.711 |
0.000 0.000 | 0.000 |
0.000 0.000 | 0.000 |
||
| Plot | Lyso | Other | |||||||||||
| Expt C |
4 peptides |
17 spectra |
|
0.000 0.000 | 0.000 |
1.000 1.000 | 1.000 |