 6
6peptides
spectra
0.000 | 0.000
0.000 | 0.000
0.000 | 0.000
0.307 | 0.332
0.209 | 0.252
0.030 | 0.065
0.389 | 0.405
0.000 | 0.000
| Plot | Mito | Lyso | Perox | ER | Golgi | PM | Cytosol | Nucleus | |||||
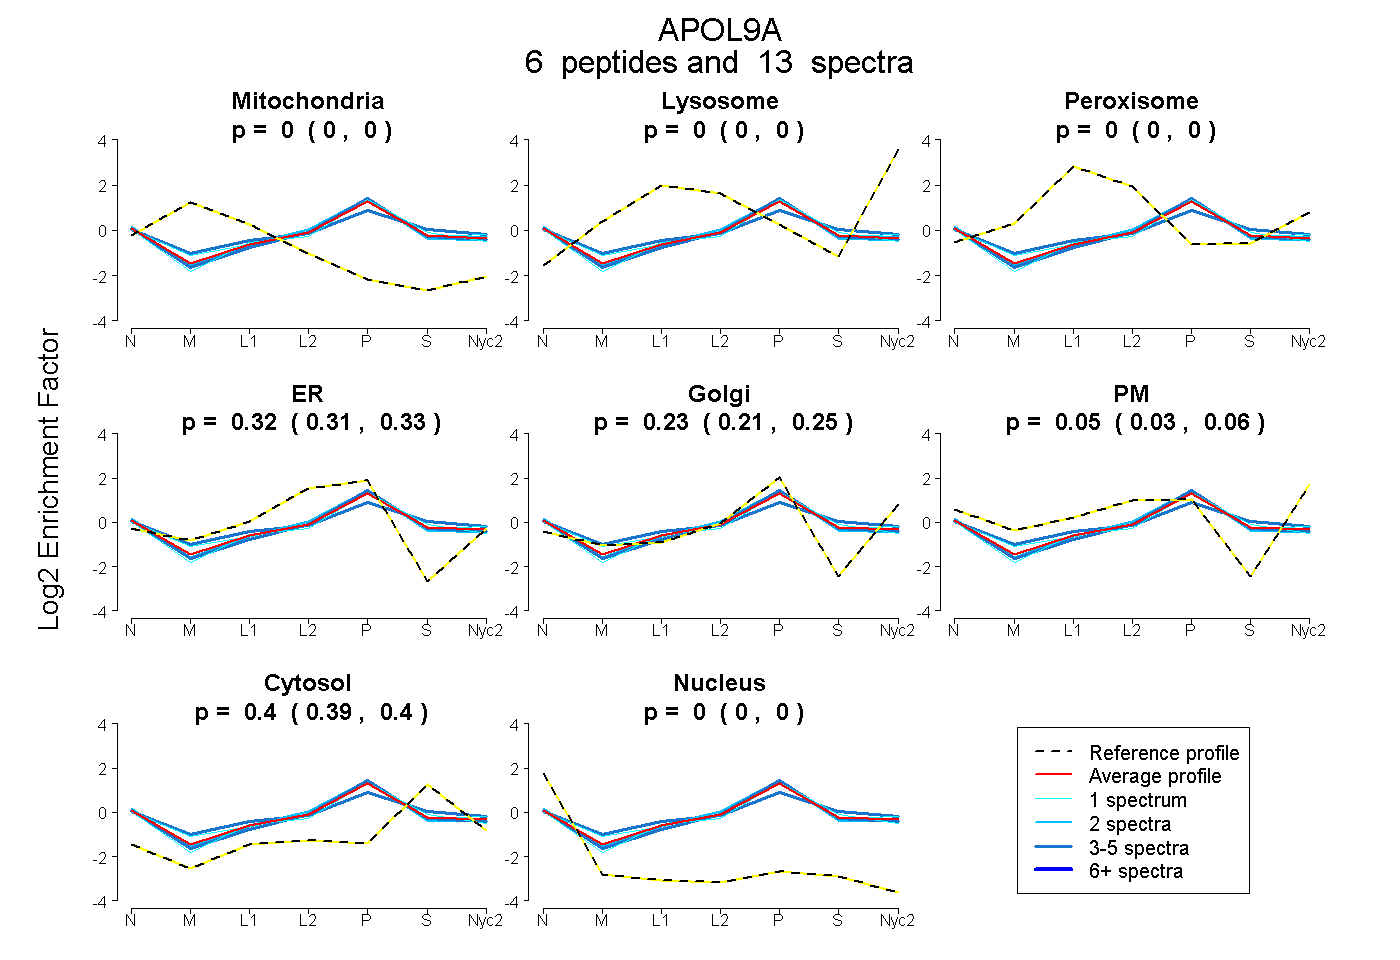
| Expt A |
6 peptides |
13 spectra |
|
0.000 0.000 | 0.000 |
0.000 0.000 | 0.000 |
0.000 0.000 | 0.000 |
0.321 0.307 | 0.332 |
0.232 0.209 | 0.252 |
0.049 0.030 | 0.065 |
0.398 0.389 | 0.405 |
0.000 0.000 | 0.000 |
| 3 spectra, DVGSLVNESK | 0.000 | 0.000 | 0.116 | 0.141 | 0.248 | 0.092 | 0.403 | 0.000 | ||
| 2 spectra, DLTALLAIAER | 0.000 | 0.000 | 0.000 | 0.393 | 0.233 | 0.000 | 0.375 | 0.000 | ||
| 2 spectra, IASEIPQATR | 0.000 | 0.000 | 0.000 | 0.356 | 0.262 | 0.009 | 0.373 | 0.000 | ||
| 1 spectrum, QLYEGSASESAAALR | 0.000 | 0.000 | 0.000 | 0.315 | 0.256 | 0.000 | 0.430 | 0.000 | ||
| 4 spectra, LAQELEEK | 0.000 | 0.000 | 0.000 | 0.301 | 0.310 | 0.000 | 0.388 | 0.000 | ||
| 1 spectrum, LGELMK | 0.000 | 0.000 | 0.052 | 0.208 | 0.366 | 0.029 | 0.345 | 0.000 |
| Plot | Mito | Lyso or Perox | ER | Golgi | PM | Cytosol | Nucleus | ||||||
| Expt B |
2 peptides |
2 spectra |
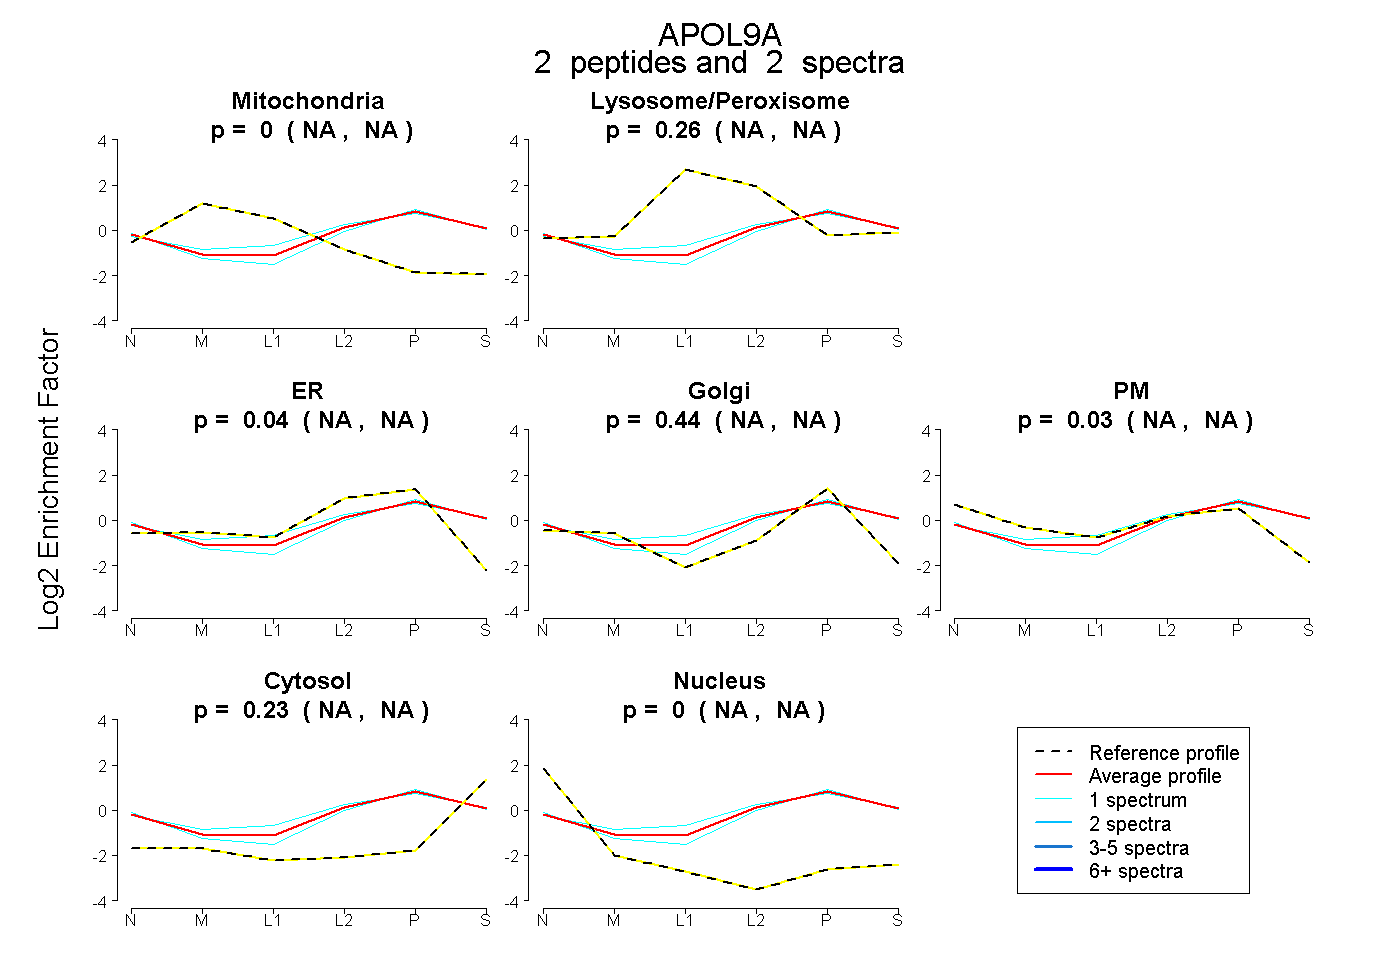 |
0.000 NA | NA |
0.264 NA | NA |
0.039 NA | NA |
0.441 NA | NA |
0.029 NA | NA |
0.227 NA | NA |
0.000 NA | NA |
|||
| Plot | Lyso | Other | |||||||||||
| Expt C |
2 peptides |
4 spectra |
 |
0.000 0.000 | 0.000 |
1.000 1.000 | 1.000 |
||||||||
| Plot | Lyso | Other | |||||||||||
| Expt D |
1 peptide |
1 spectrum |
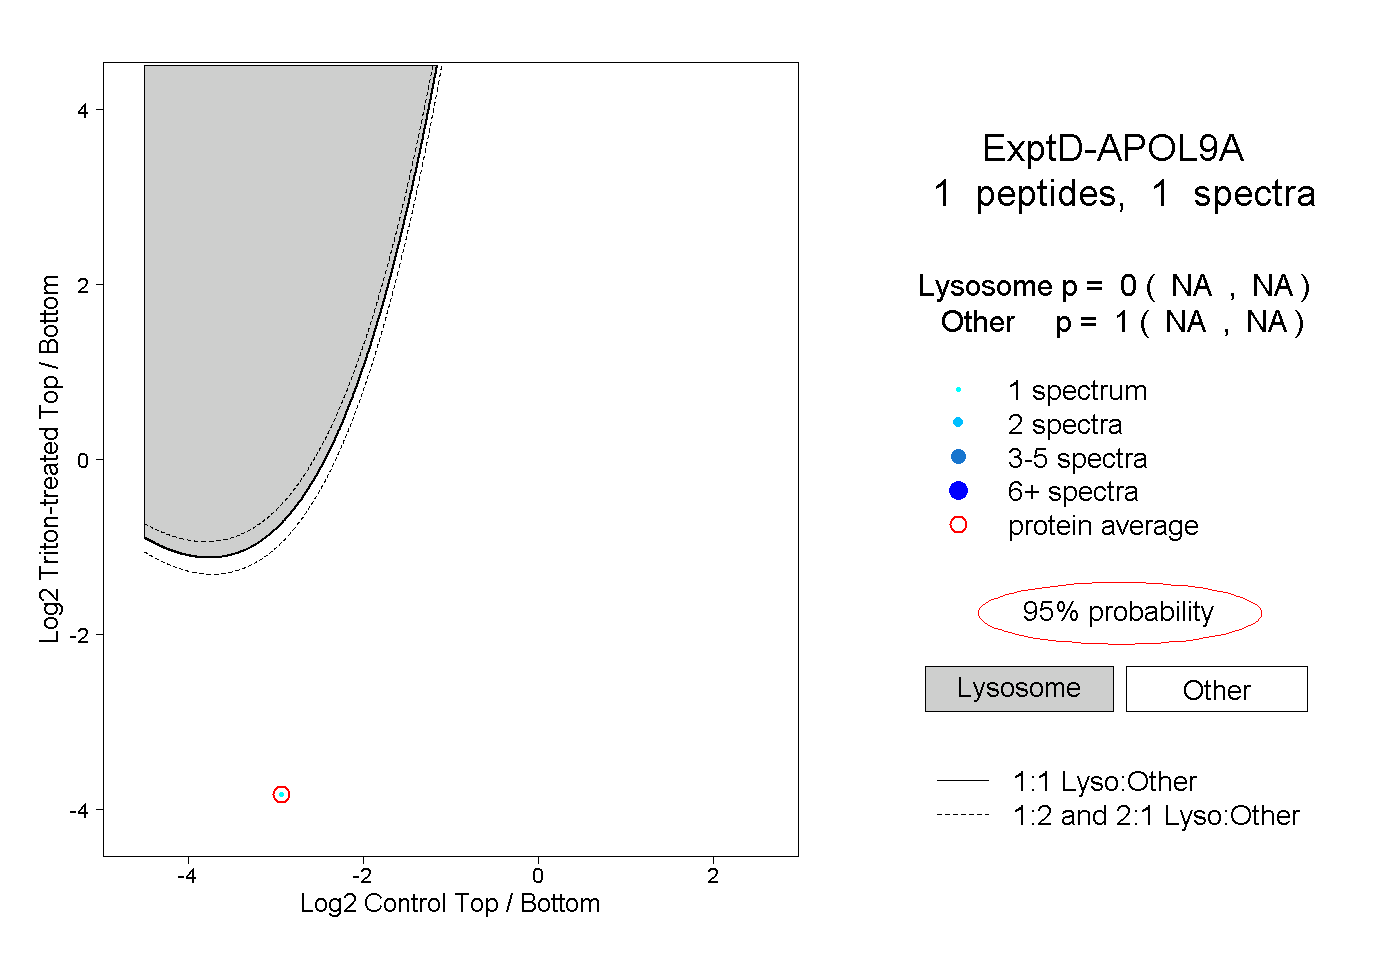 |
0.000 NA | NA |
1.000 NA | NA |