 2
2peptides
spectra
0.138 | 0.297
0.229 | 0.373
0.000 | 0.000
0.000 | 0.000
0.000 | 0.188
0.000 | 0.113
0.279 | 0.398
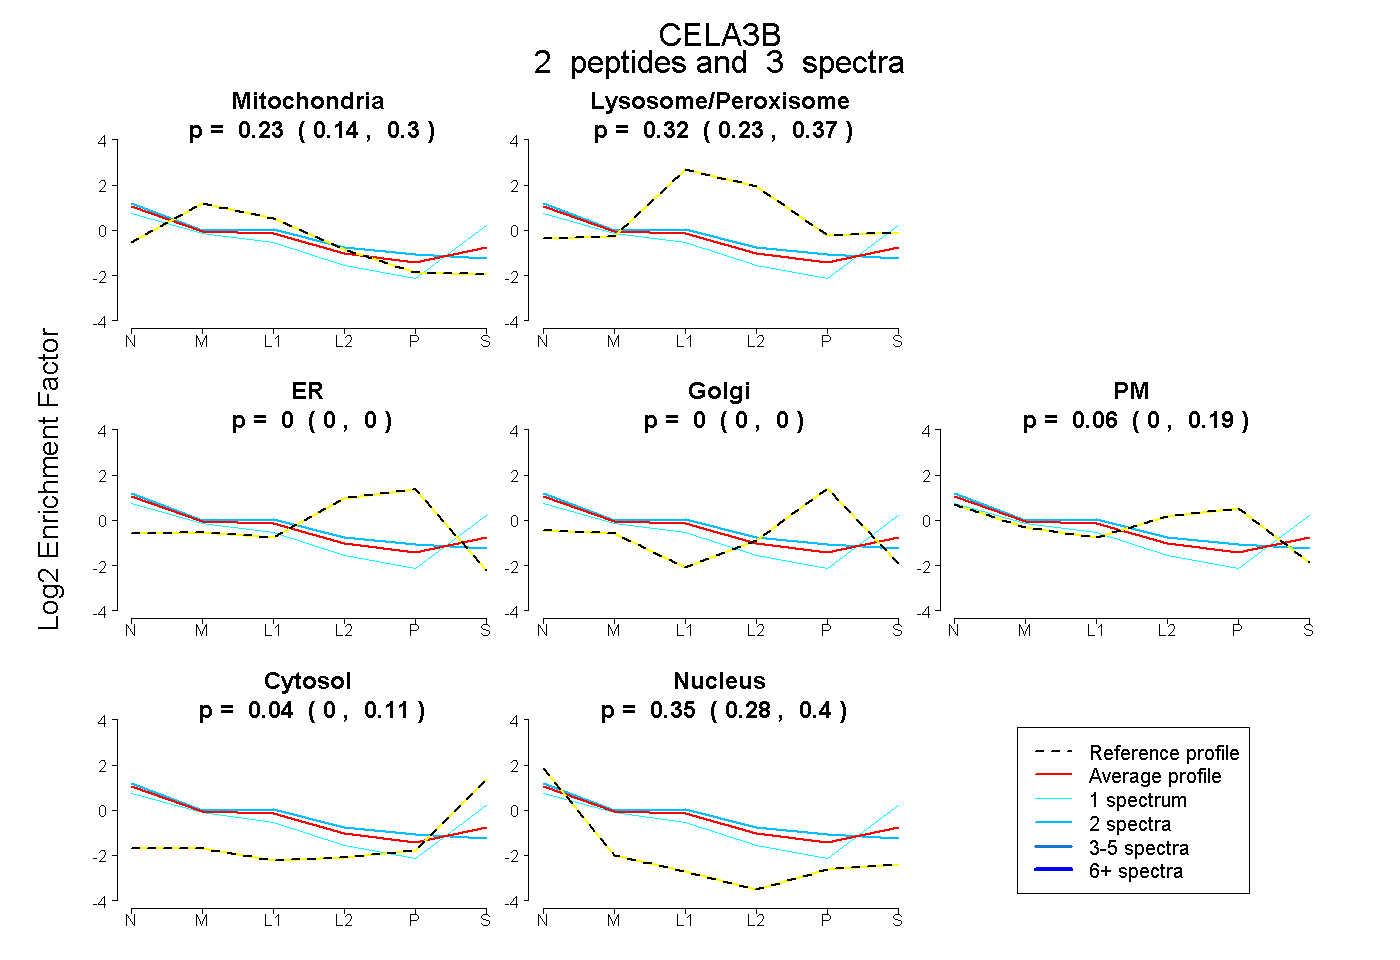
| Plot | Mito | Lyso or Perox | ER | Golgi | PM | Cytosol | Nucleus | ||||||
| Expt B |
2 peptides |
3 spectra |
|
0.228 0.138 | 0.297 |
0.319 0.229 | 0.373 |
0.000 0.000 | 0.000 |
0.000 0.000 | 0.000 |
0.056 0.000 | 0.188 |
0.043 0.000 | 0.113 |
0.354 0.279 | 0.398 |
| 1 spectrum, TYQVVLGEFER | 0.240 | 0.205 | 0.000 | 0.000 | 0.000 | 0.282 | 0.274 | |||
| 2 spectra, KPTVFTR | 0.214 | 0.278 | 0.000 | 0.000 | 0.214 | 0.000 | 0.294 |