 5
5peptides
spectra
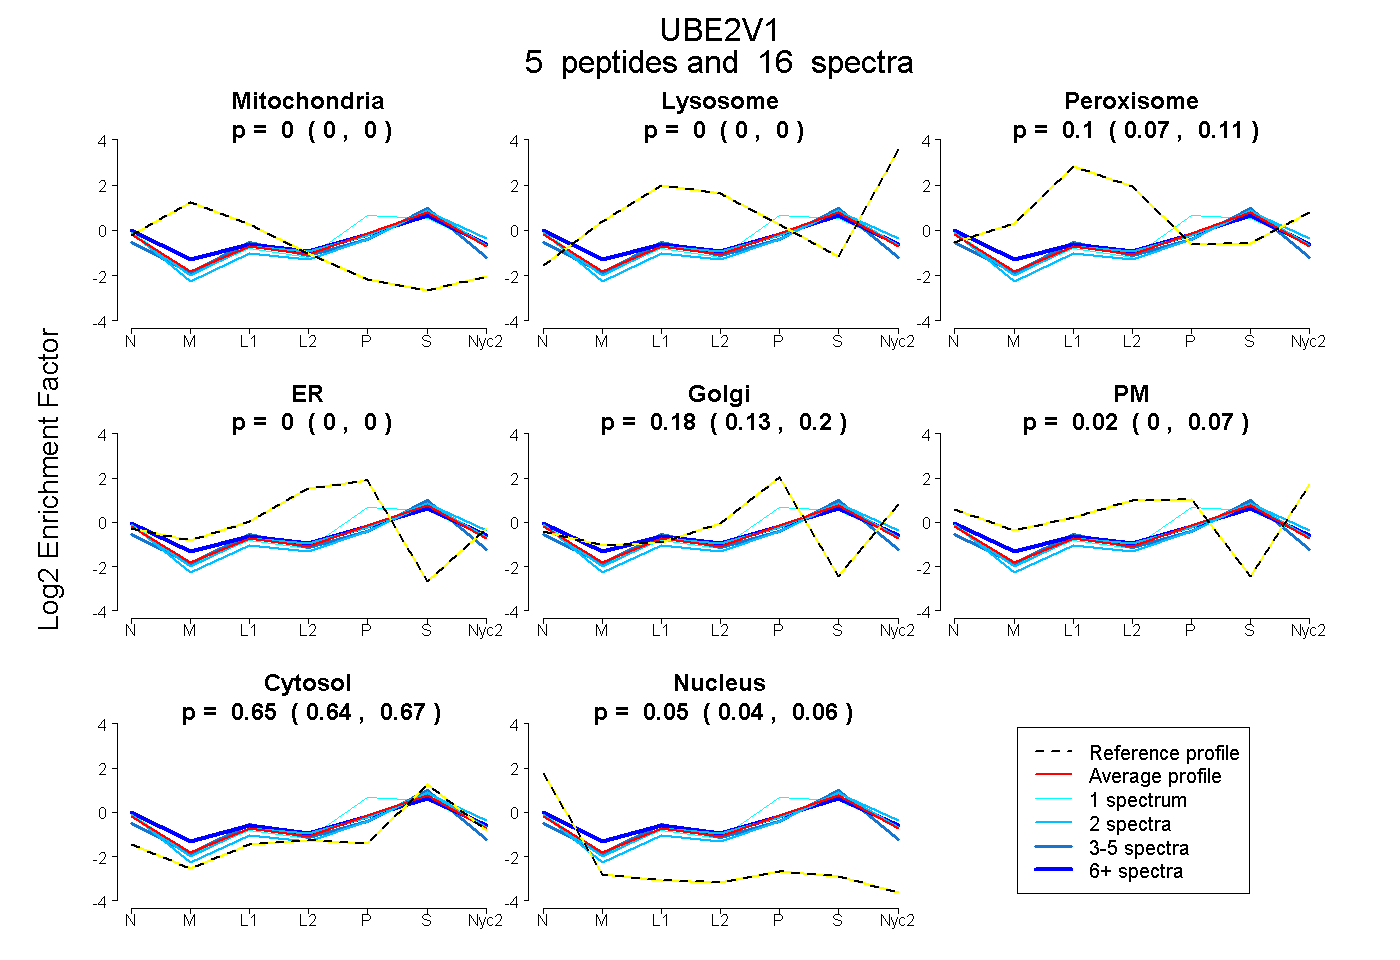
0.000 | 0.000
0.000 | 0.000
0.073 | 0.113
0.000 | 0.000
0.130 | 0.205
0.000 | 0.067
0.639 | 0.669
0.035 | 0.056
3peptides
spectra
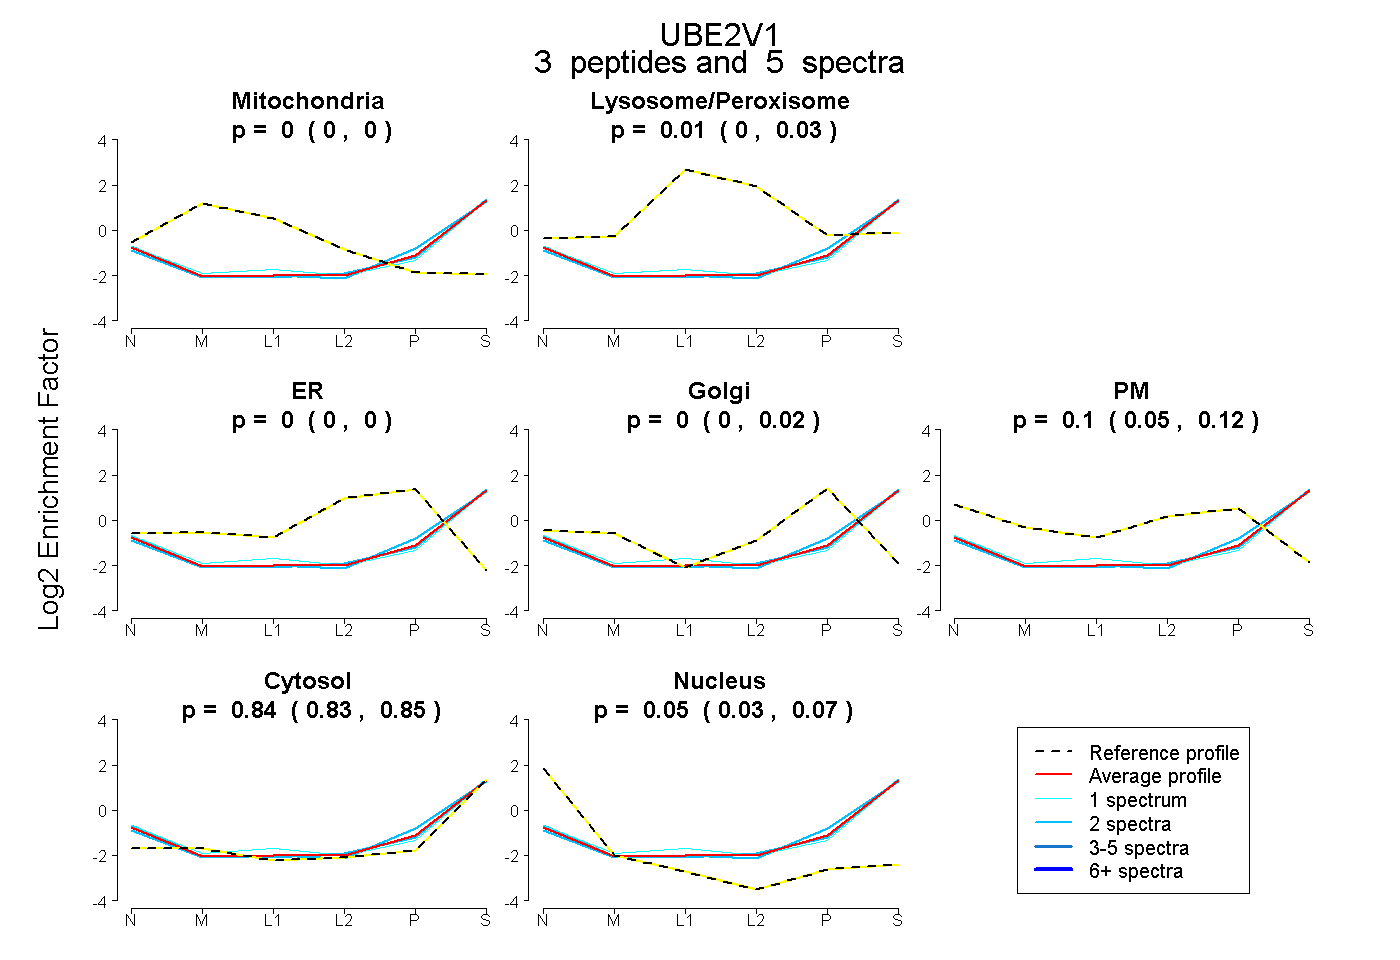
0.000 | 0.000
0.000 | 0.033
0.000 | 0.000
0.000 | 0.020
0.047 | 0.118
0.831 | 0.852
0.029 | 0.072
6peptides
spectra
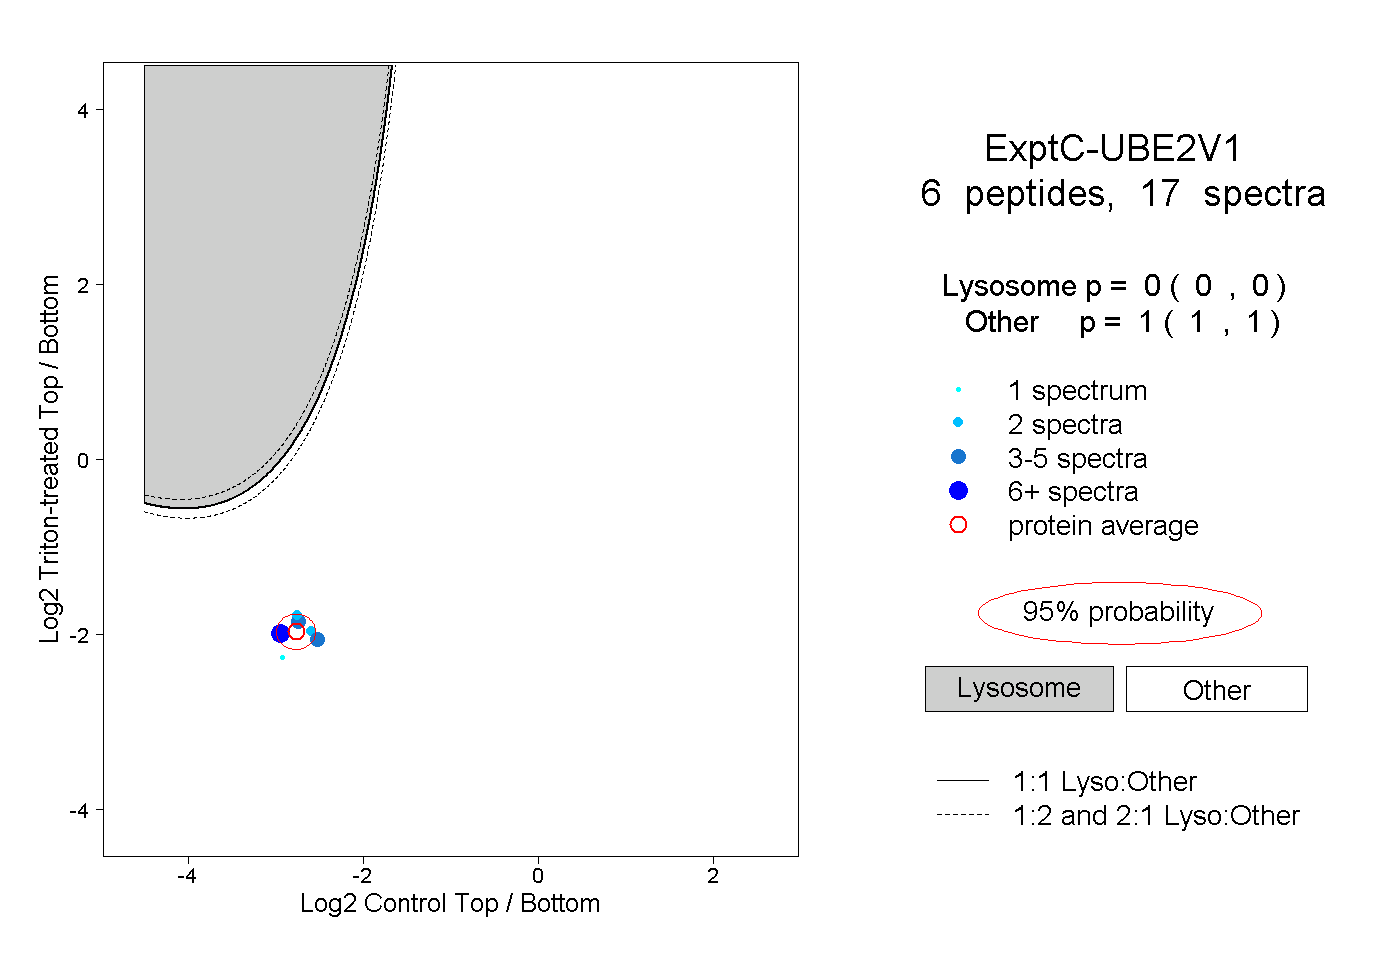
0.000 | 0.000
1.000 | 1.000
1peptide
spectrum
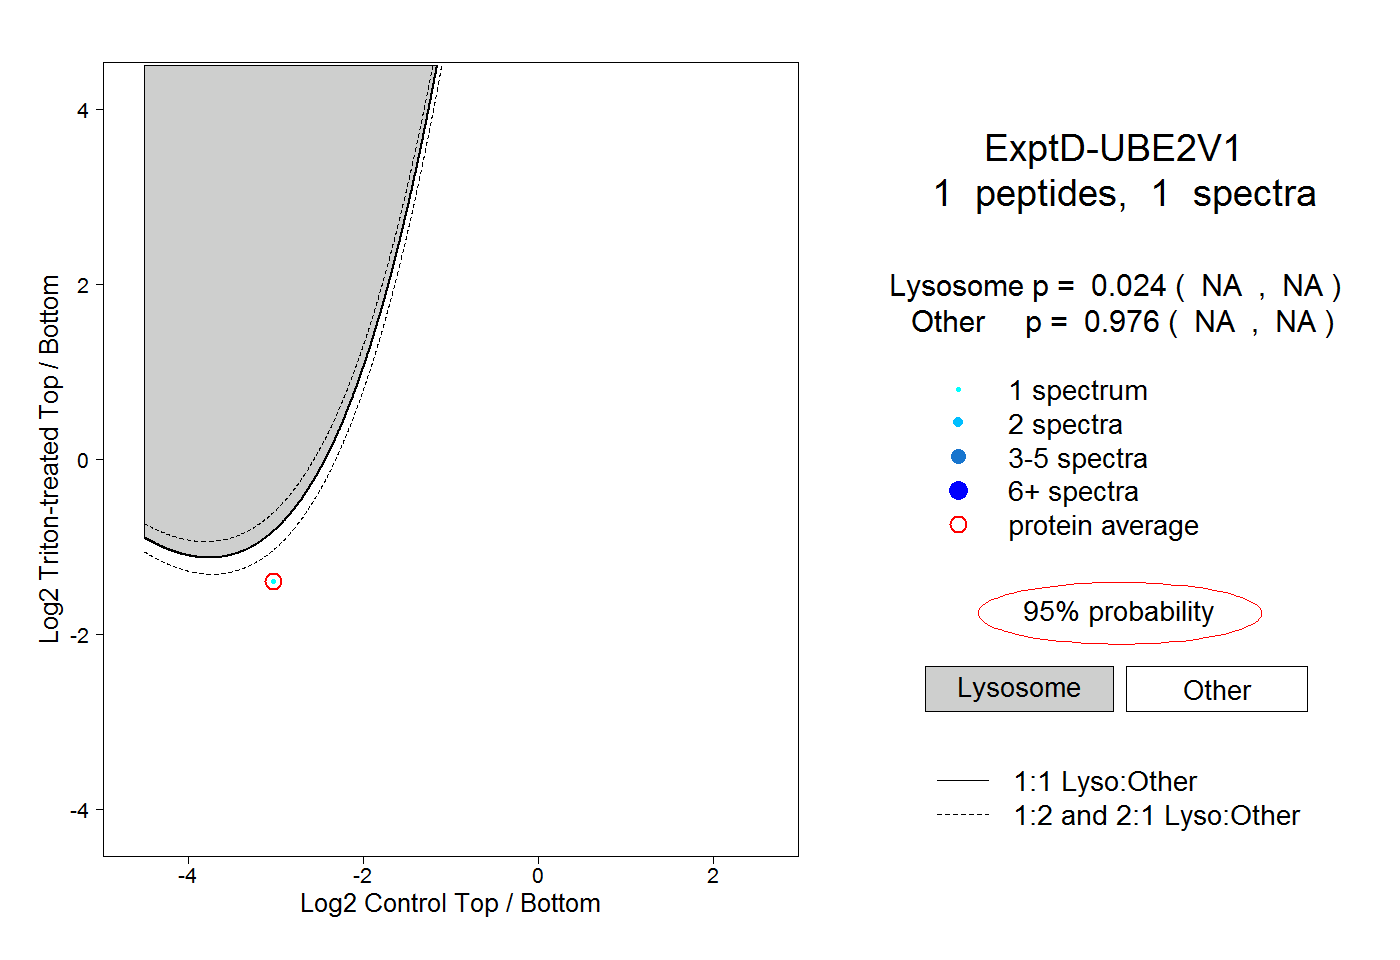
NA | NA
NA | NA