 1
1peptide
spectra
0.000 | 0.000
0.000 | 0.000
0.000 | 0.000
0.000 | 0.120
0.103 | 0.244
0.107 | 0.261
0.470 | 0.559
0.036 | 0.095
1peptide
spectra
0.000 | 0.000
1.000 | 1.000
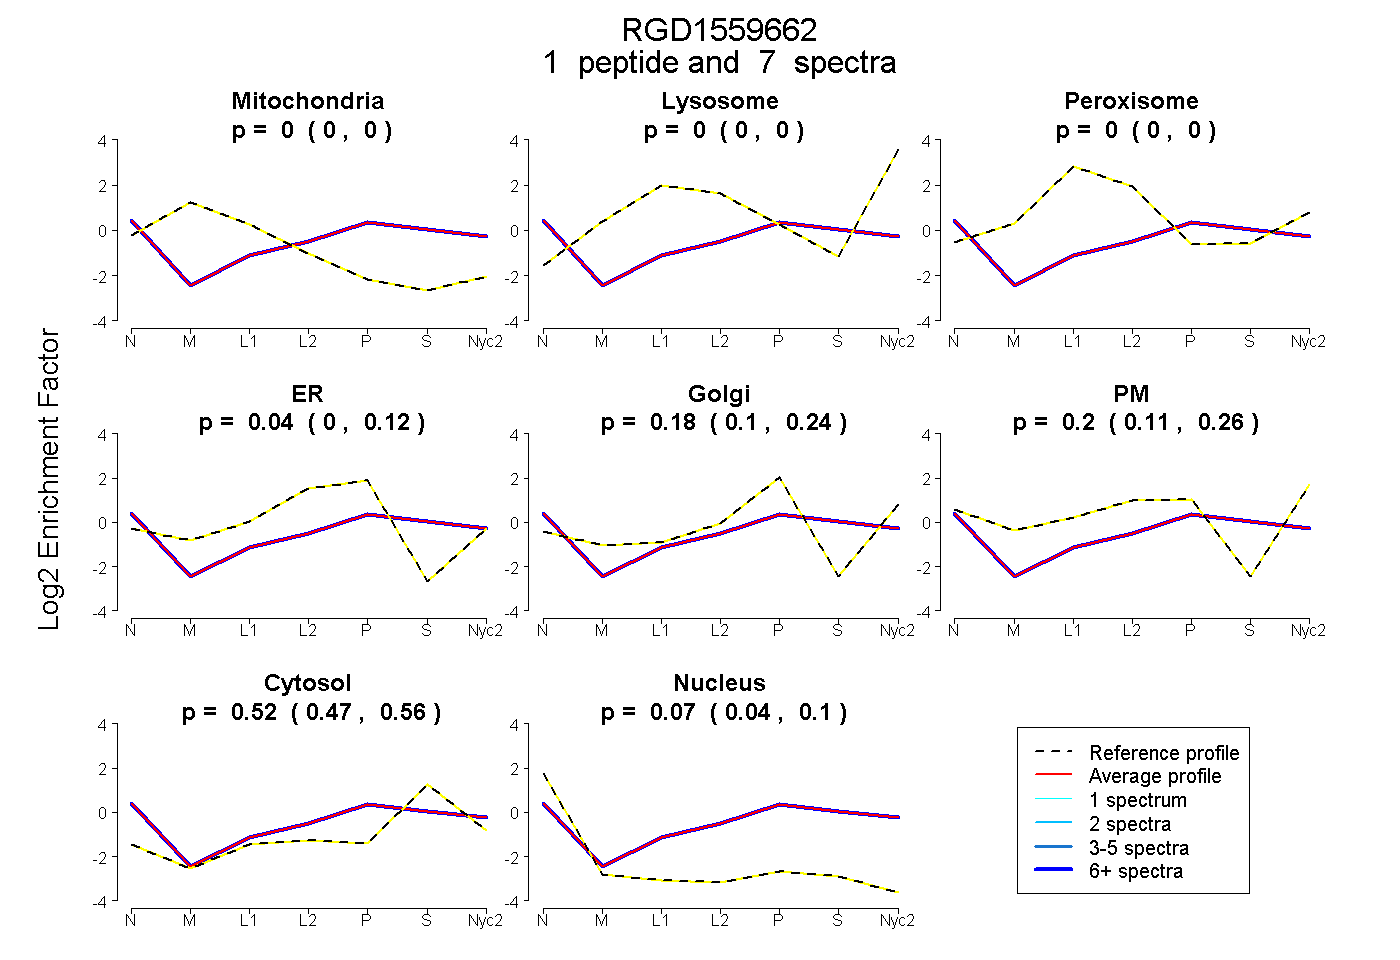
| Plot | Mito | Lyso | Perox | ER | Golgi | PM | Cytosol | Nucleus | |||||
| Expt A |
1 peptide |
7 spectra |
|
0.000 0.000 | 0.000 |
0.000 0.000 | 0.000 |
0.000 0.000 | 0.000 |
0.037 0.000 | 0.120 |
0.184 0.103 | 0.244 |
0.195 0.107 | 0.261 |
0.516 0.470 | 0.559 |
0.068 0.036 | 0.095 |
||
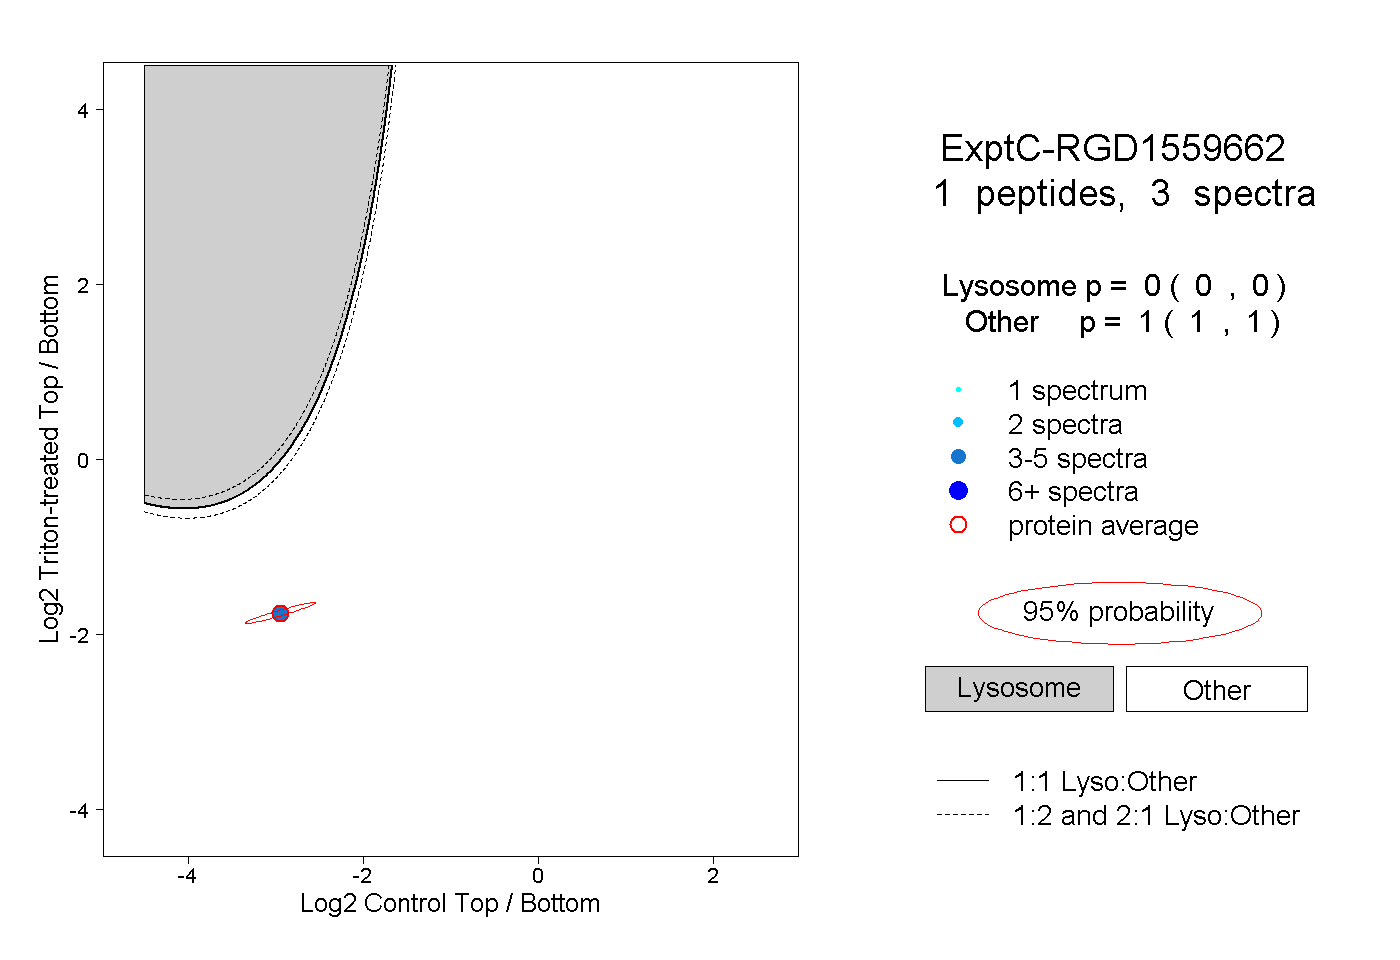
| Plot | Lyso | Other | |||||||||||
| Expt C |
1 peptide |
3 spectra |
|
0.000 0.000 | 0.000 |
1.000 1.000 | 1.000 |
| 3 spectra, LSLLR | 0.000 | 1.000 |