20
20peptides
spectra
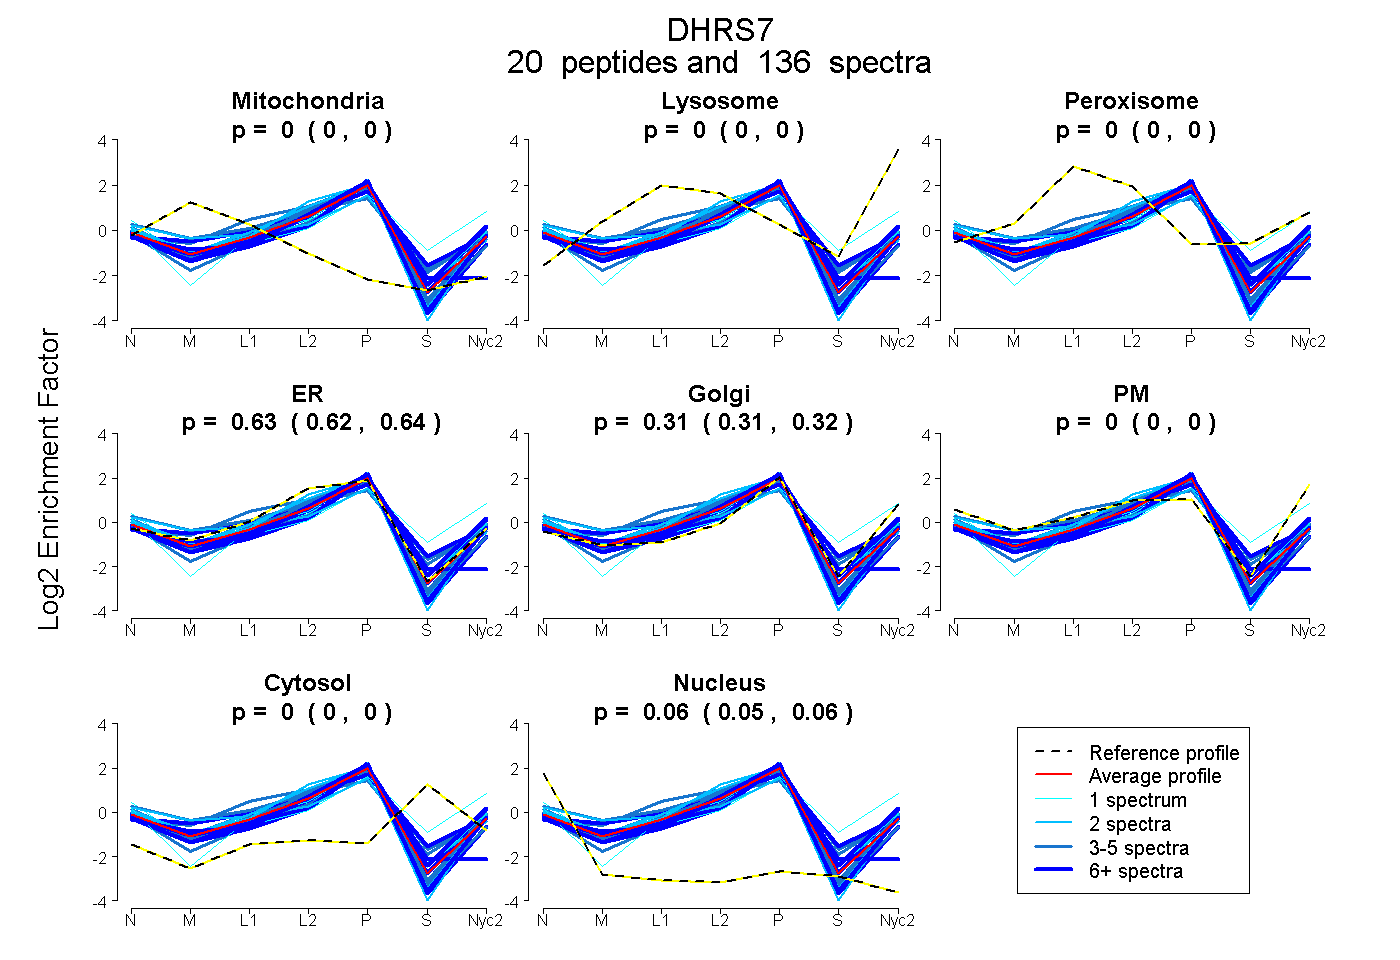
0.000 | 0.000
0.000 | 0.000
0.000 | 0.000
0.623 | 0.636
0.306 | 0.321
0.000 | 0.000
0.000 | 0.000
0.054 | 0.058
13peptides
spectra
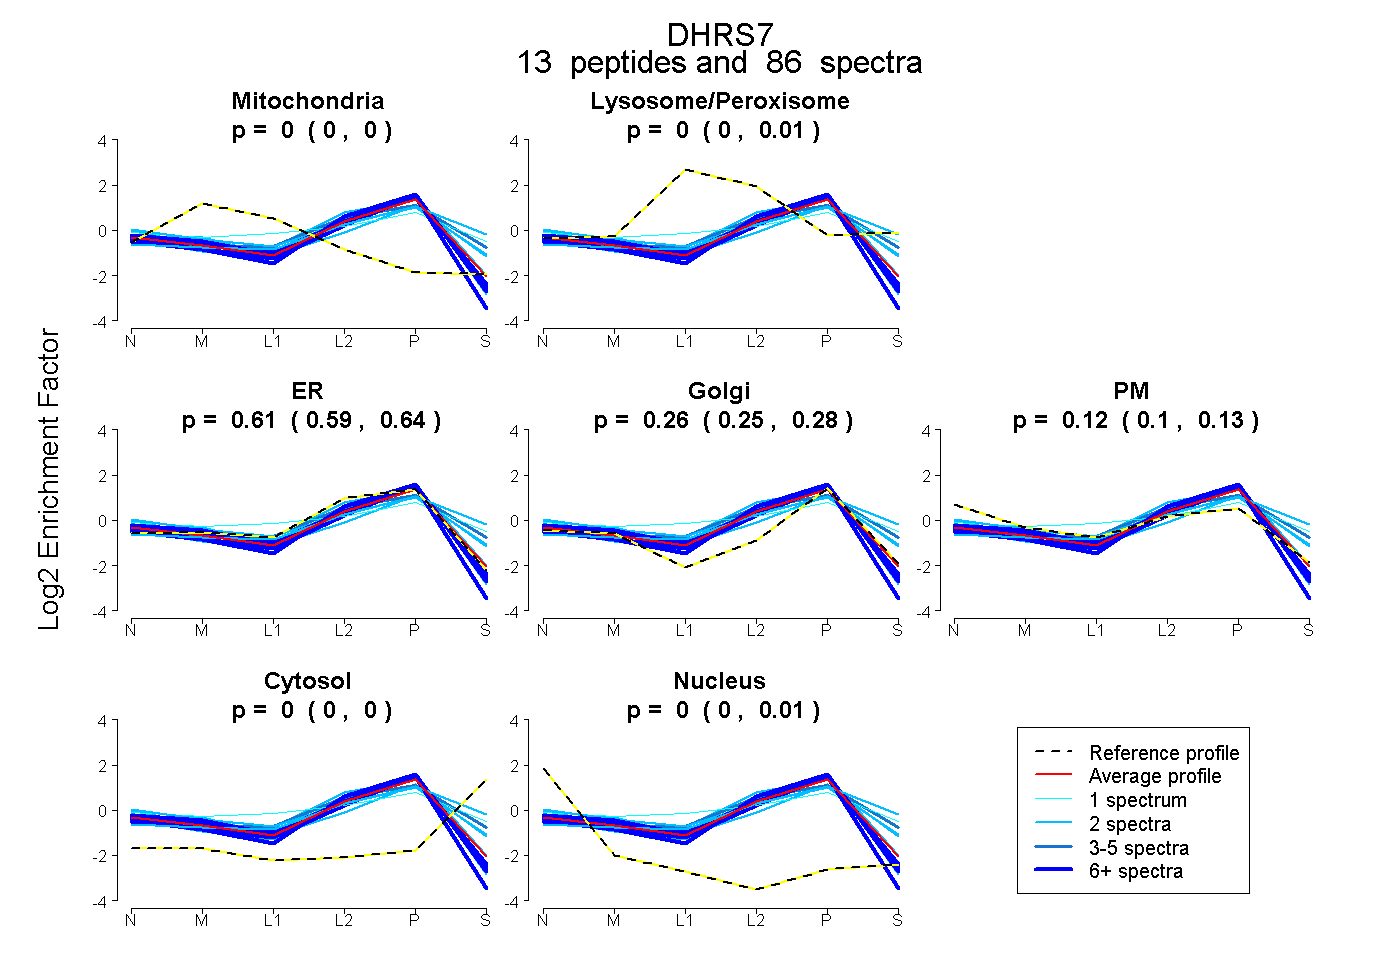
0.000 | 0.000
0.000 | 0.012
0.590 | 0.637
0.247 | 0.279
0.102 | 0.128
0.000 | 0.003
0.000 | 0.007
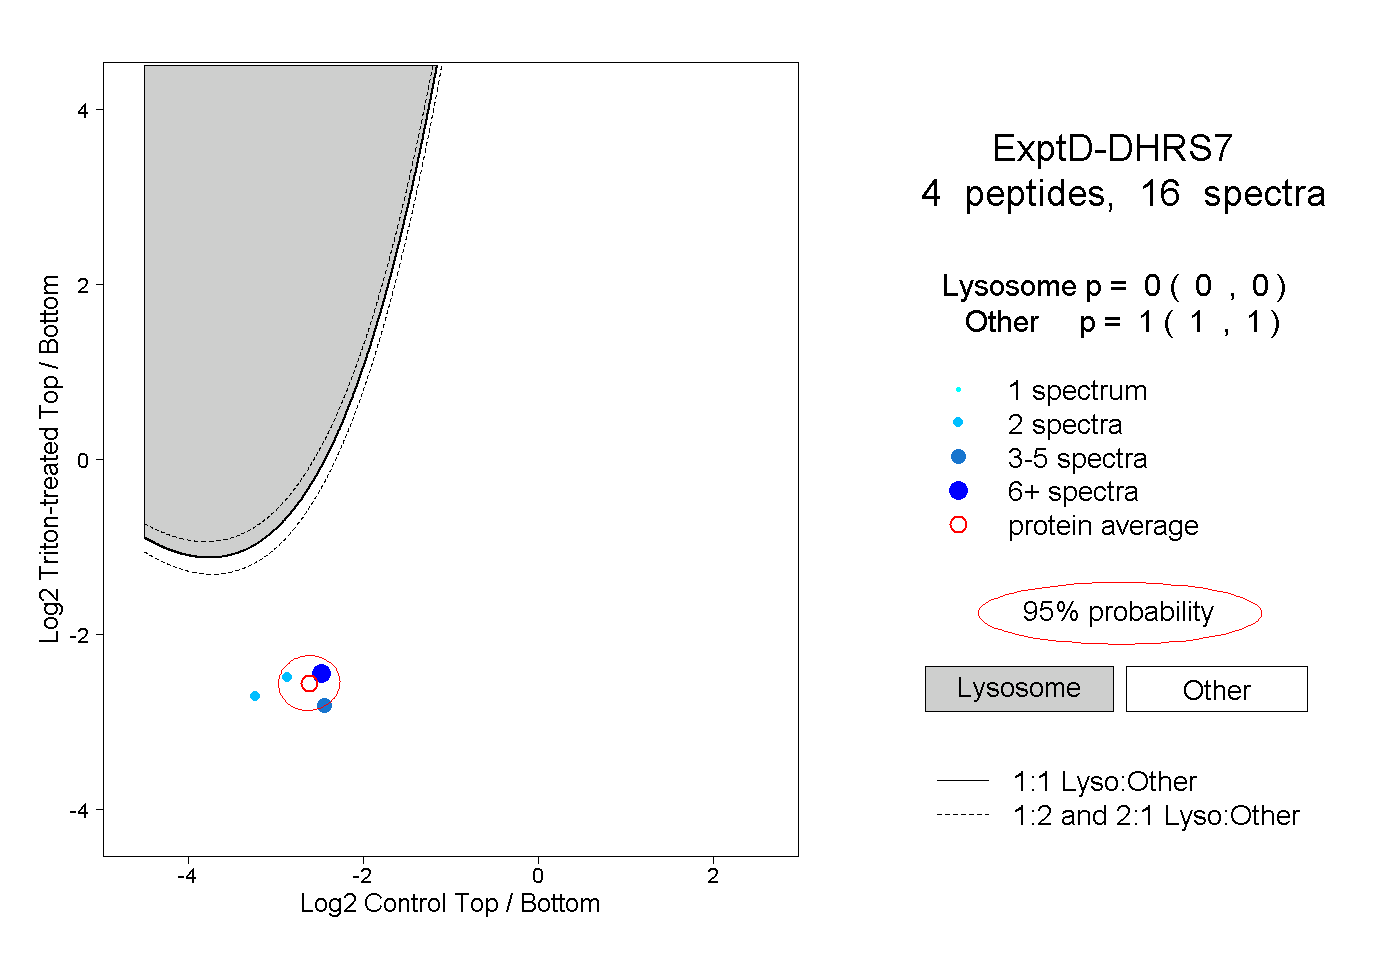
15peptides
spectra
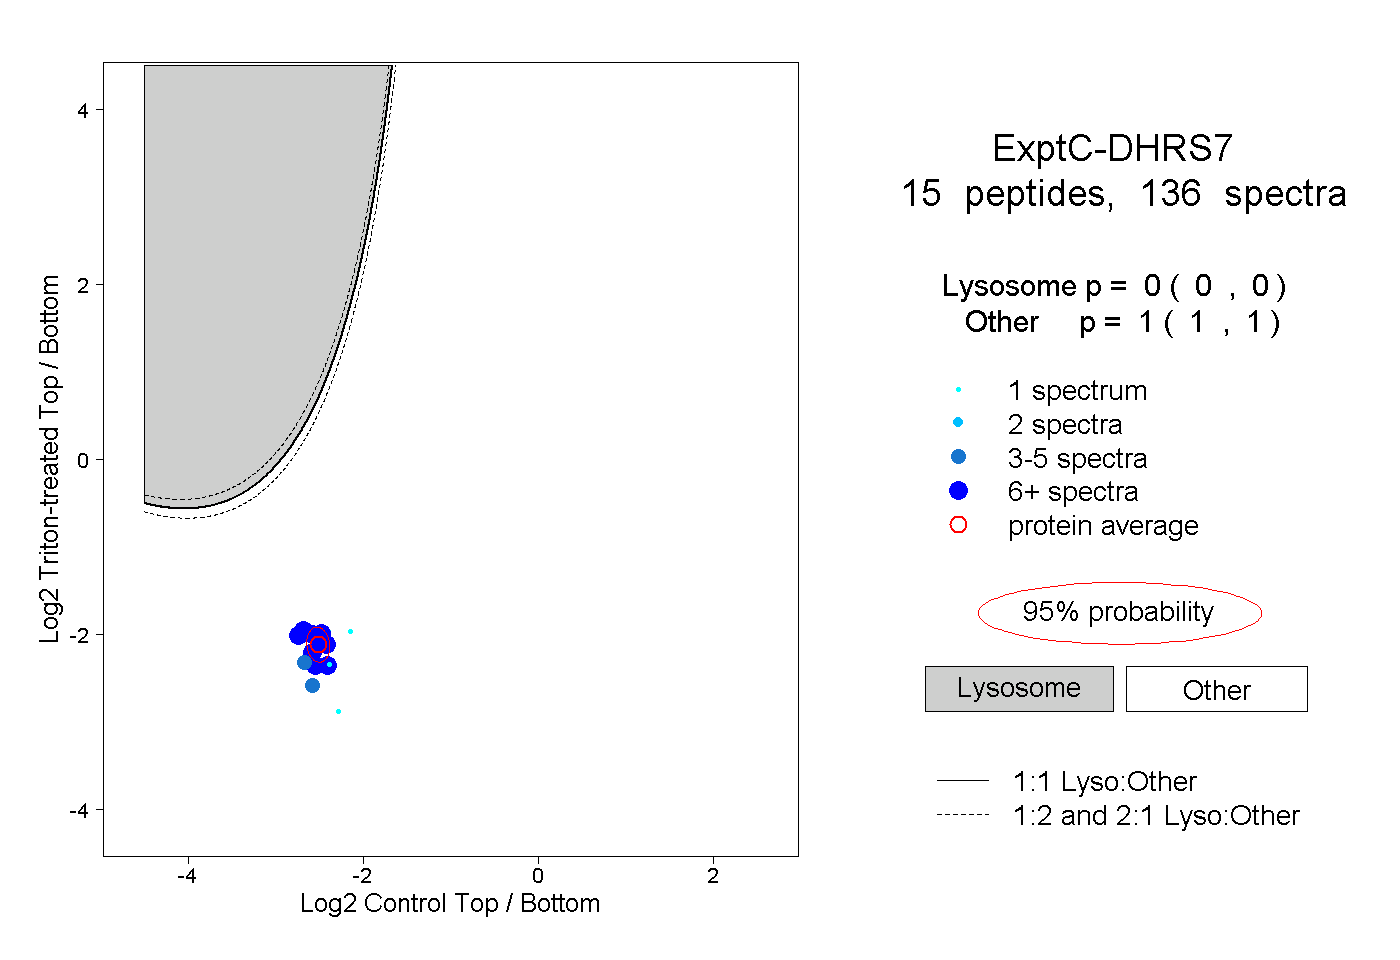
0.000 | 0.000
1.000 | 1.000